From week 1, our digital workshops have been spent building up process books. These books give us somewhere to record the new skills we are learning in module 002. (Skills in screen-printing, bookbinding and in digital design software.) I have a feeling these 3 areas will soon come together…
In this weeks’ workshop, we focused on colour. I’ve learnt a bit about colour swatches in Adobe InDesign. Colour swatches are similar to the painter’s palette I am used to, only digital. I have found this process satisfying and much easier than I thought it would be! Computers have improved a lot since I left school 10 years ago.
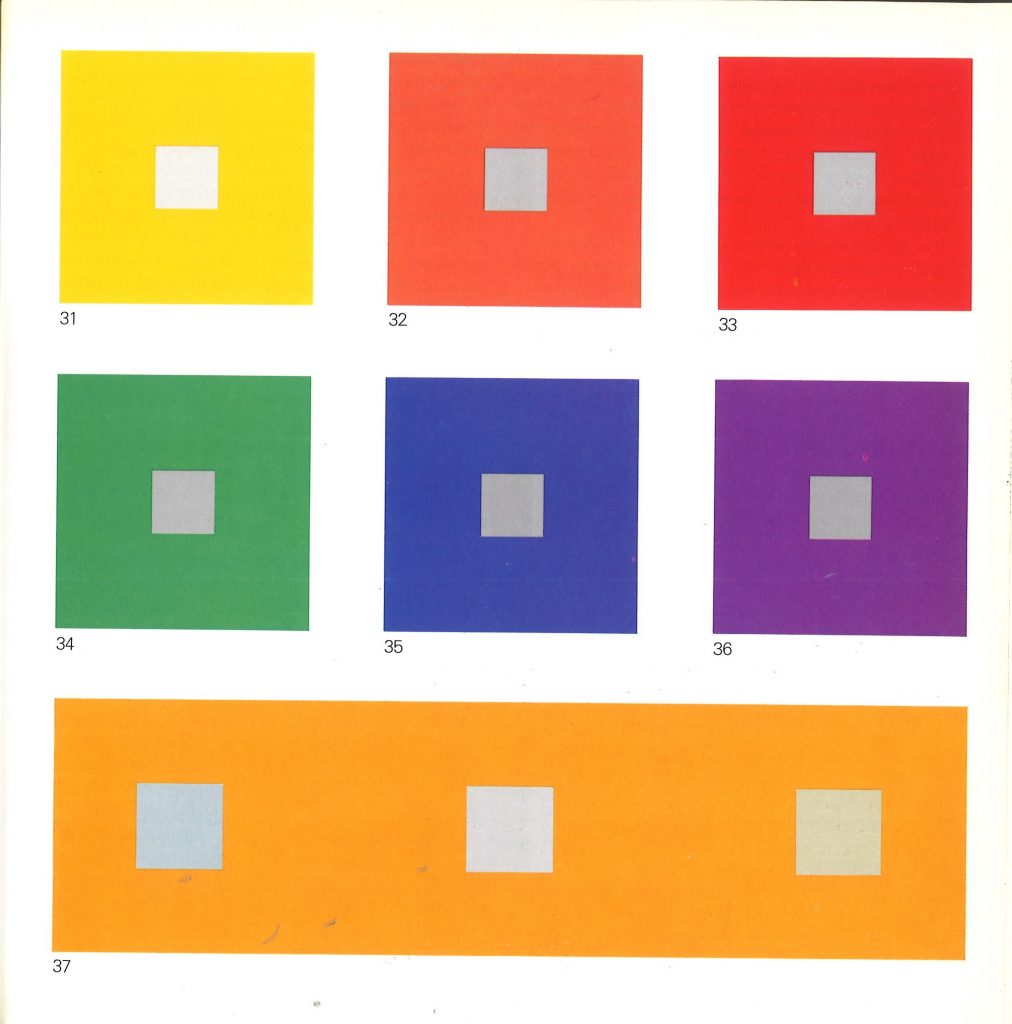
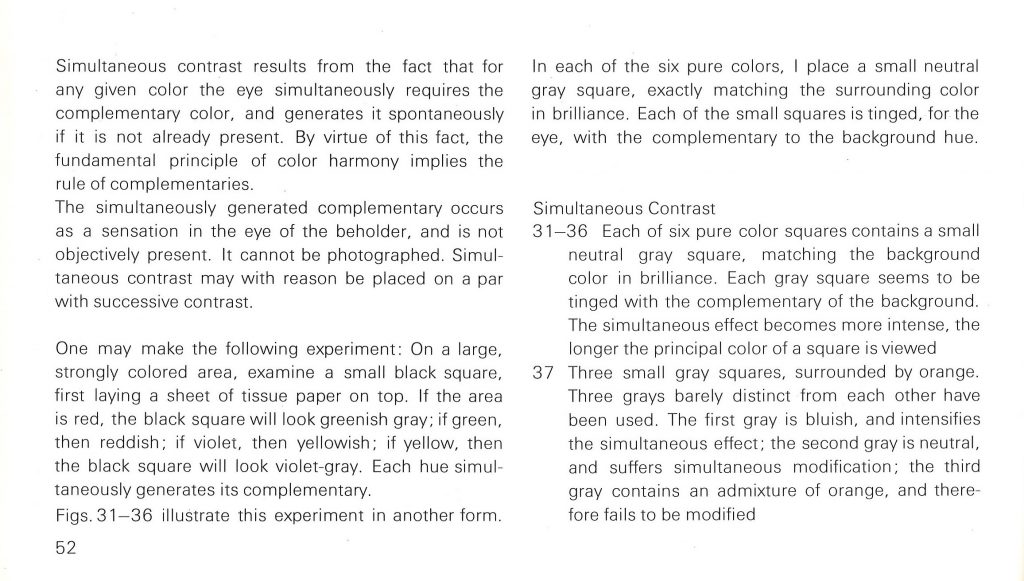
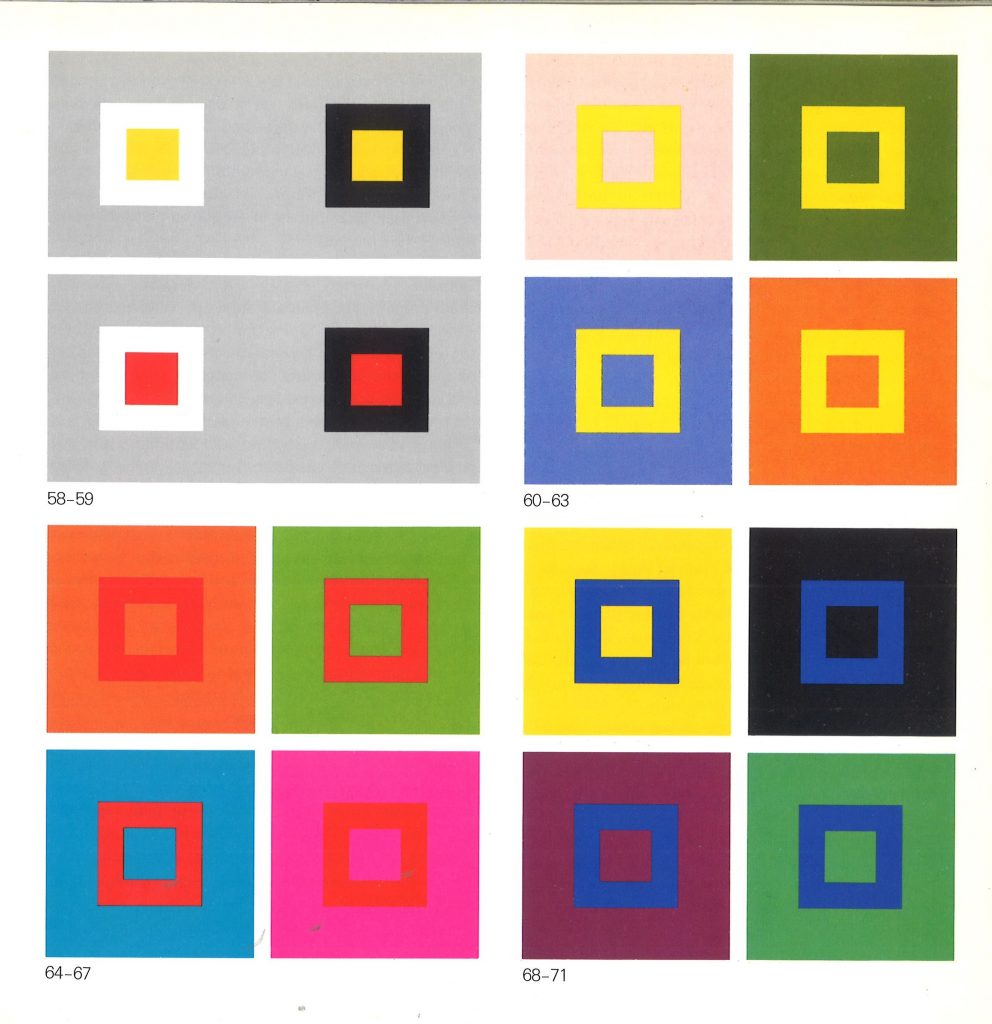
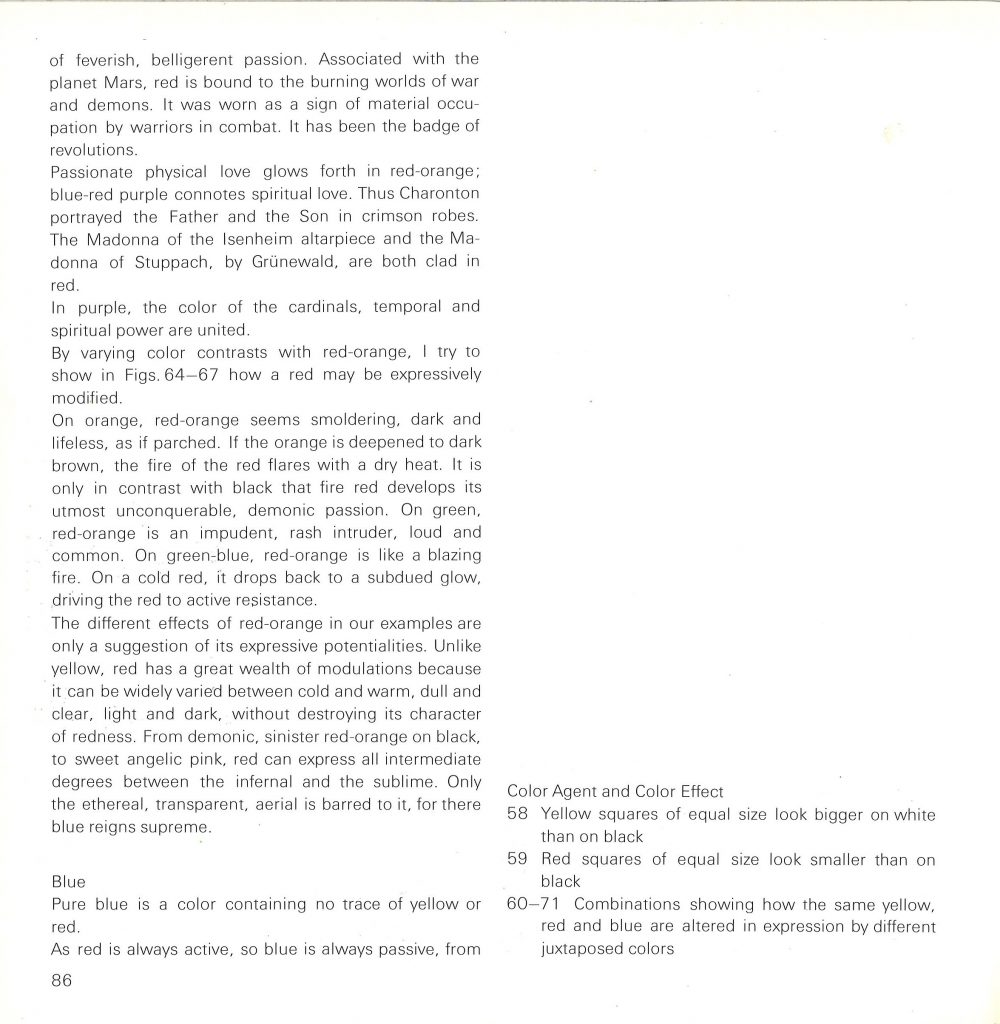
Our lecturer Adam mentioned colour relativity. At college last year, I completed a project based on the work of Josef Albers, famous colour theorist and fine artist. He spent his life exploring the relationship between colours. I took a trip to the library and came across The ELements of Color by Johannes Itten. It is a handy paperback book that explains colour relativity in simple terms:
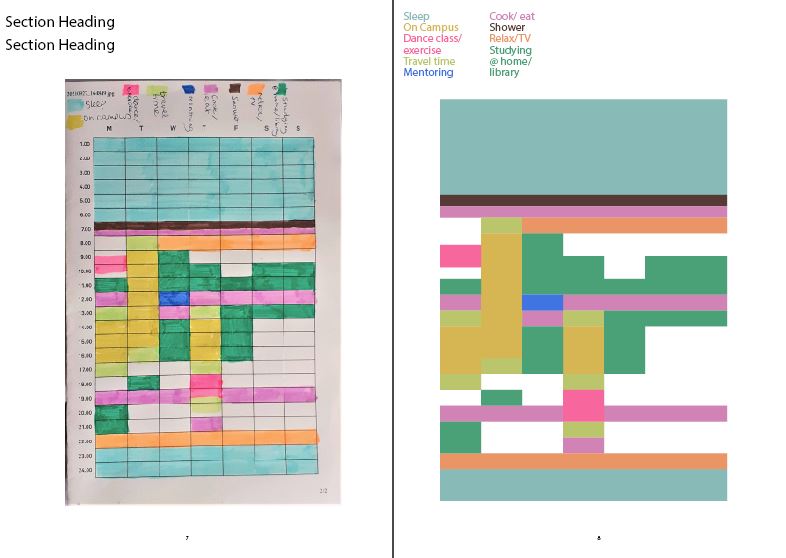
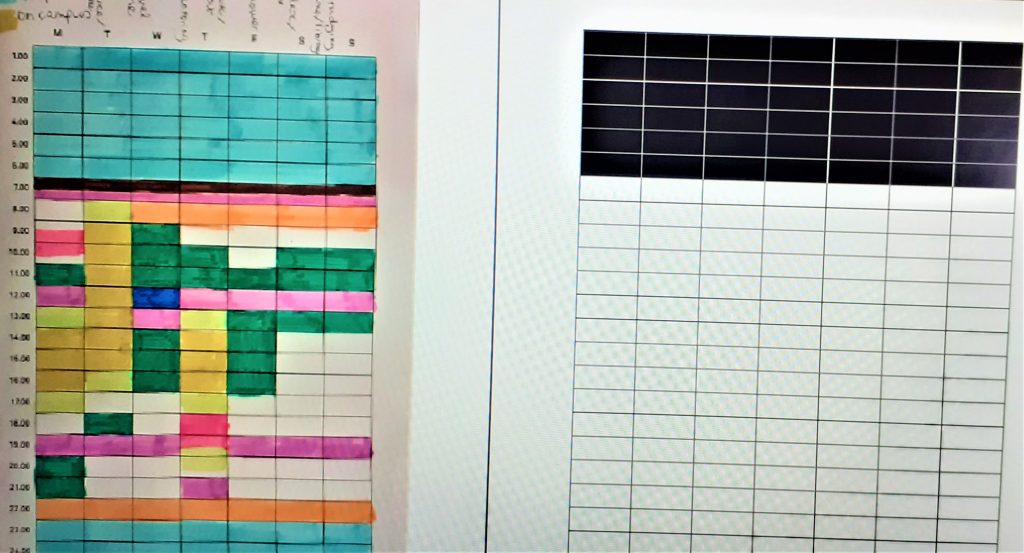
For the next task, Adam asked us to experiment with a scanned image. We coloured in timetables of our week and scanned them onto the computer:
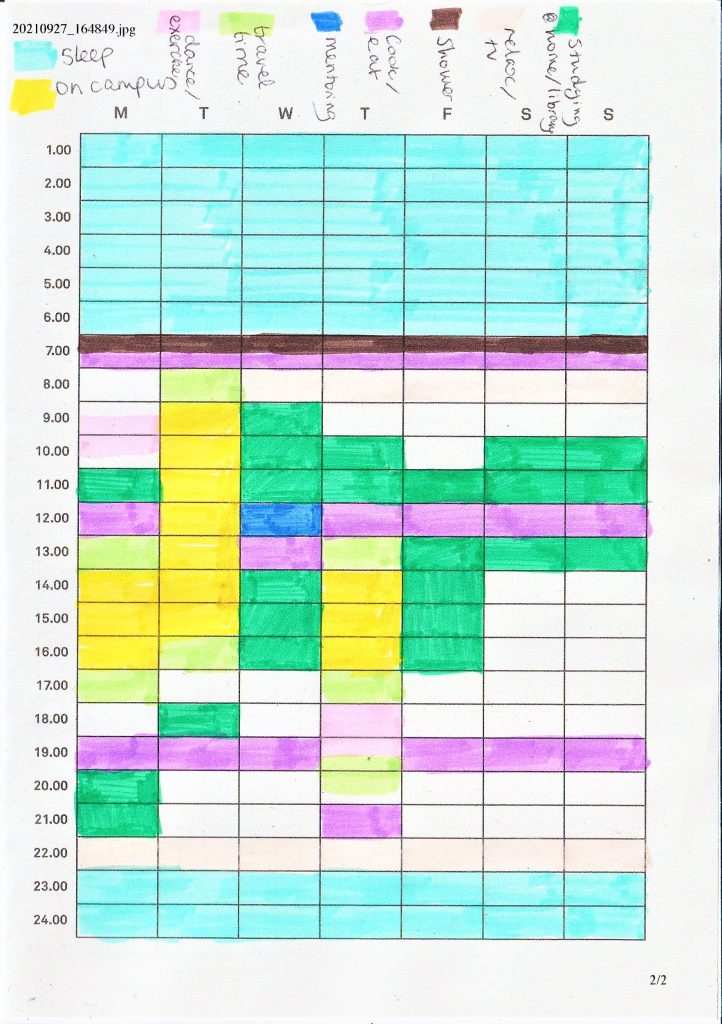
The scanner washed out the fluorescent colour from my highlight pen. Therefore, I needed to take a photo of the timetable instead.
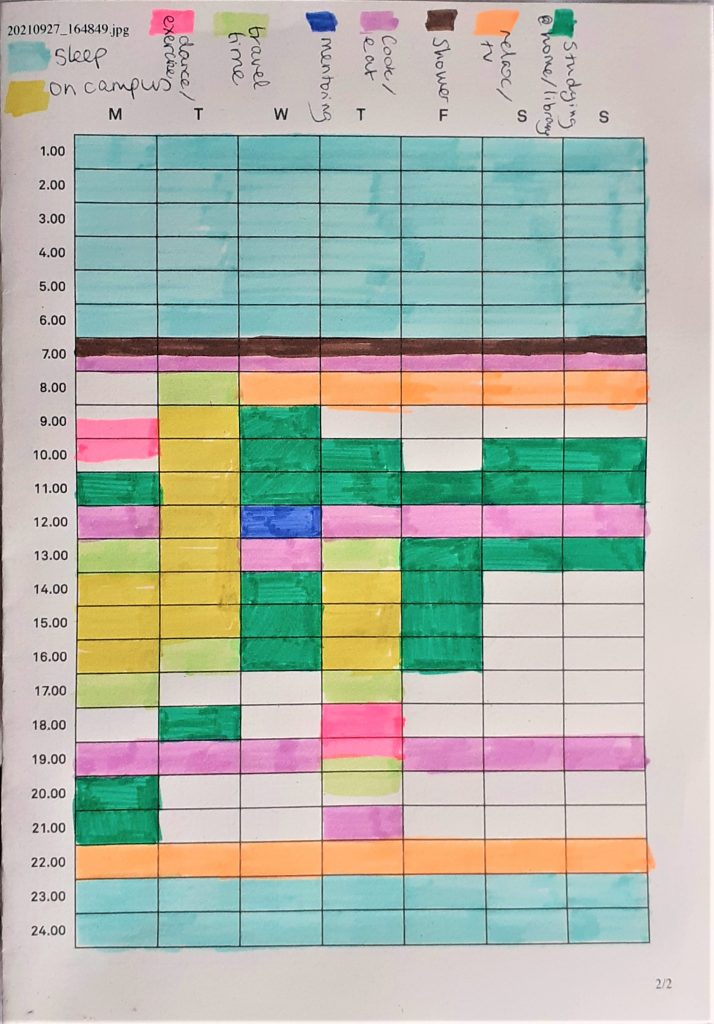
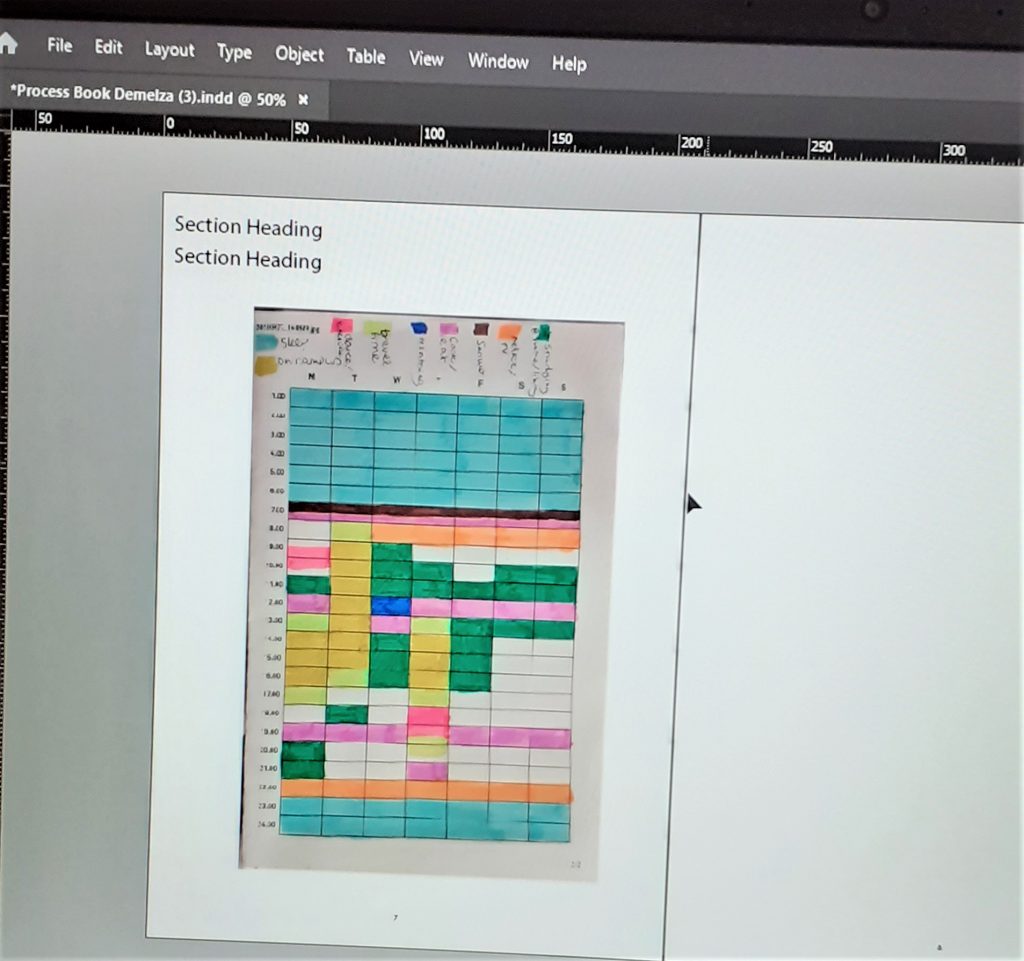
I inserted the photo into the document by pressing Command+D (Ctrl+D on Windows) and selecting the file.
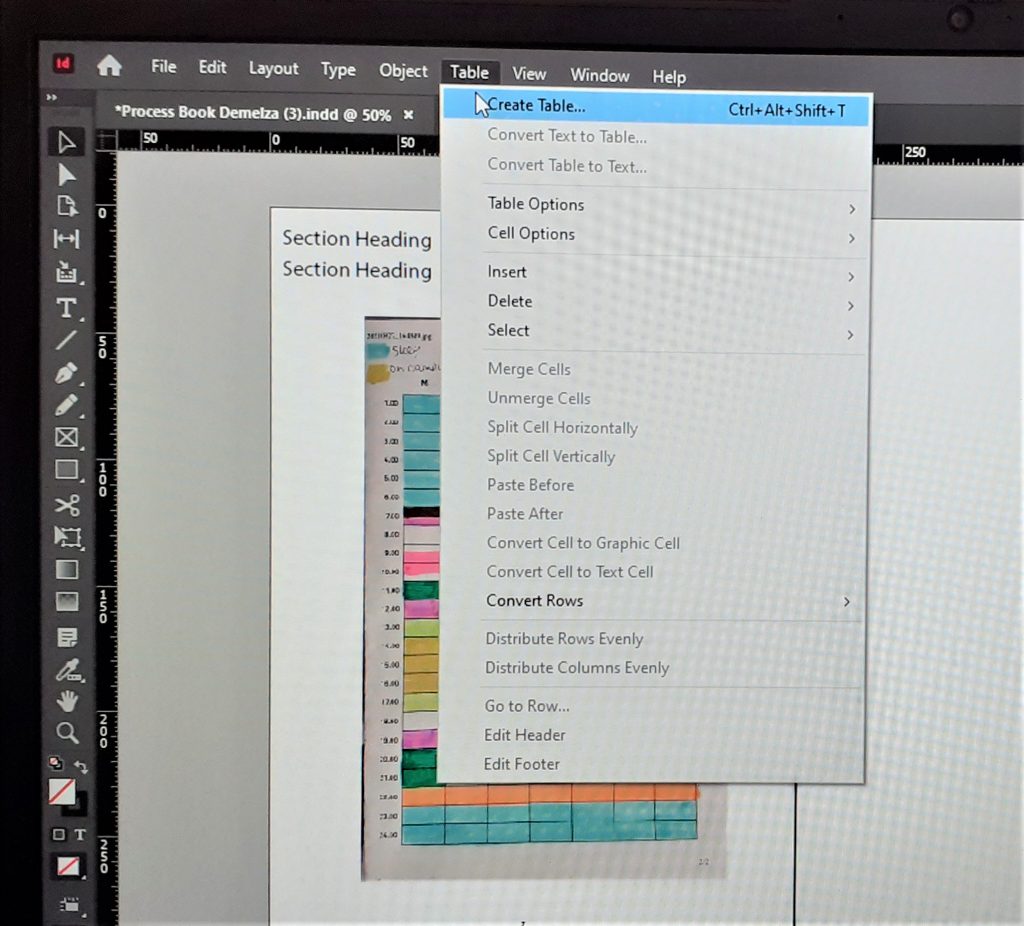
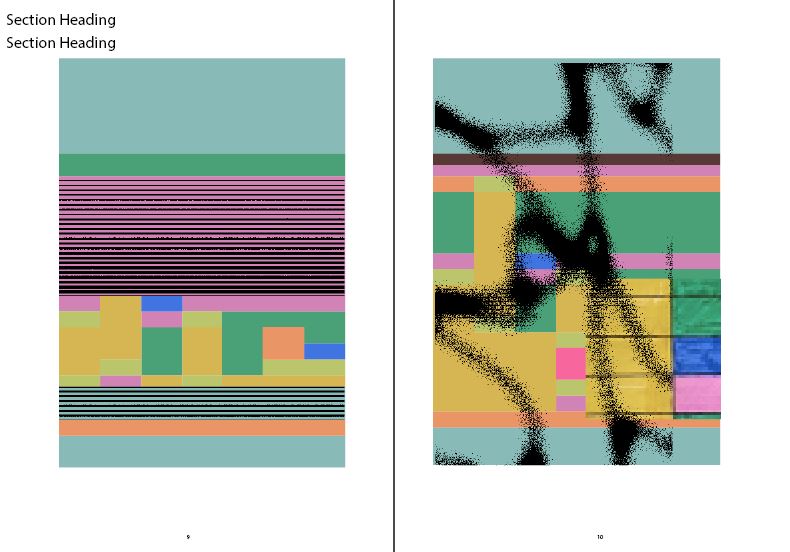
The first task was to replicate the timetable on InDesign, using the colours from the scan. I clicked ‘Table’ > ‘Create Table’.
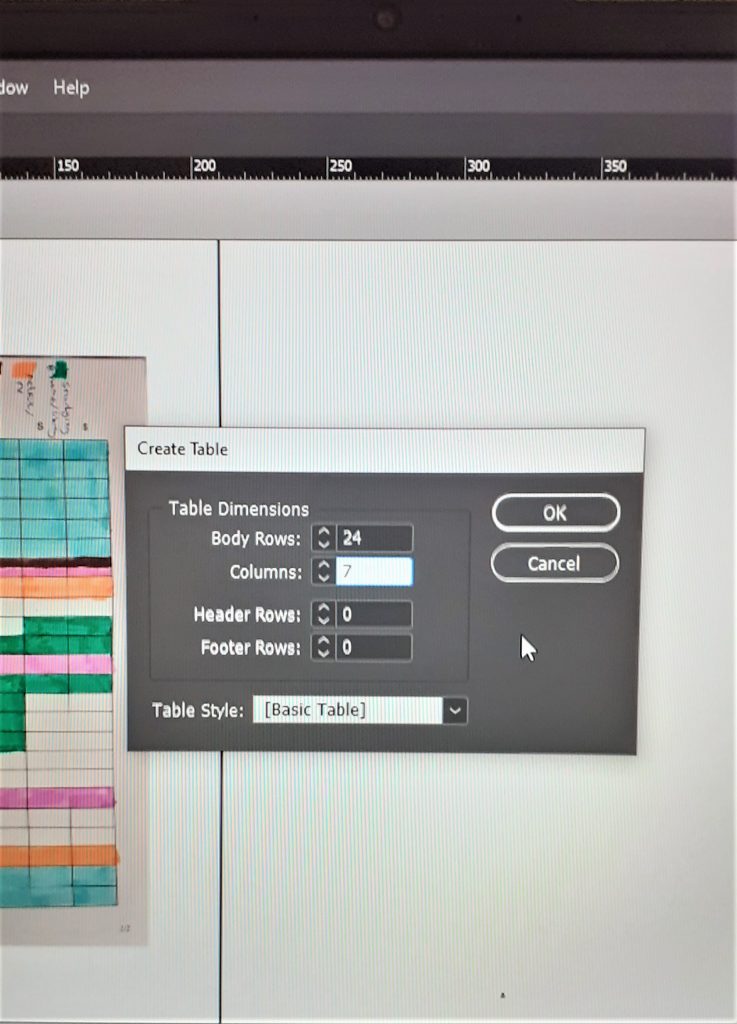
I chose 24 rows for the 24 hours of the day, and 7 columns for the days of the week. After clicking ‘OK’, I needed to click and drag the table onto the page.
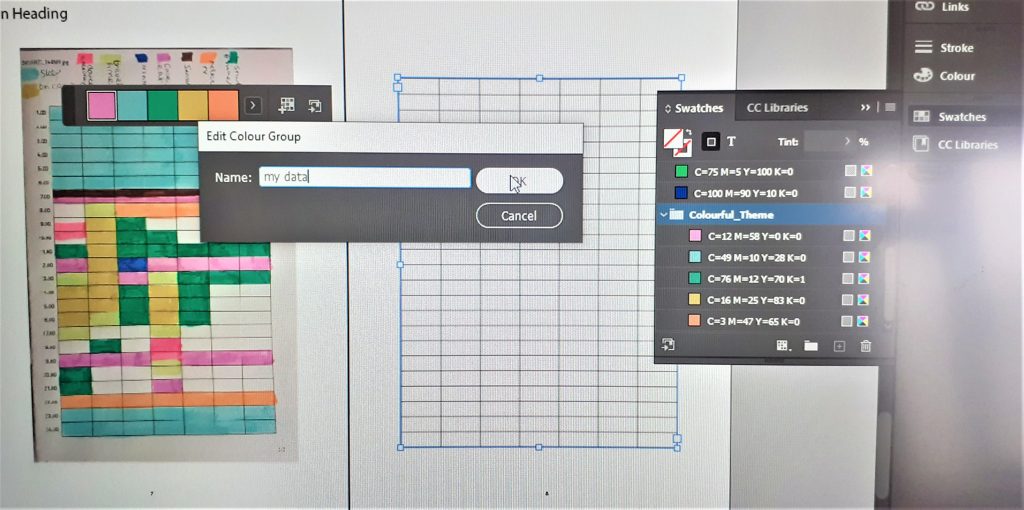
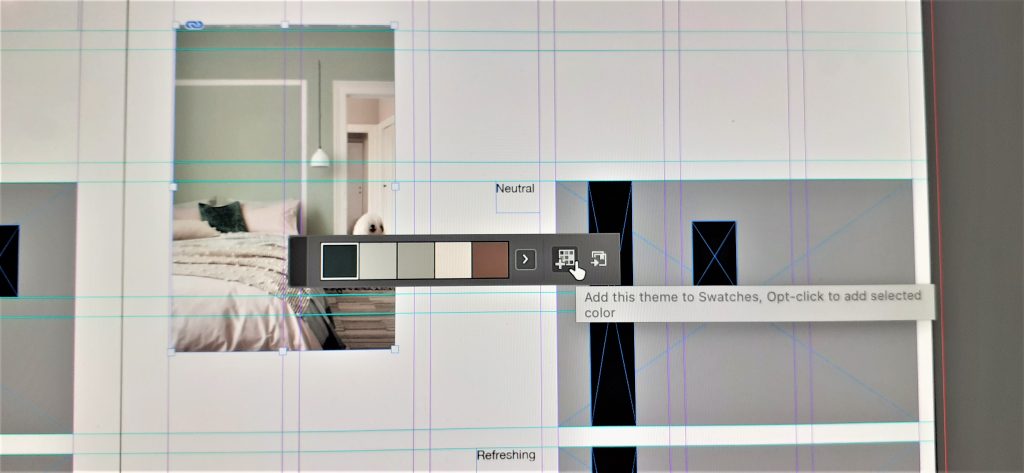
The colour theme tool picks out a limited selection of the colours within your image. Since my image has many colours, I needed to add a few of them individually to my group of swatches.
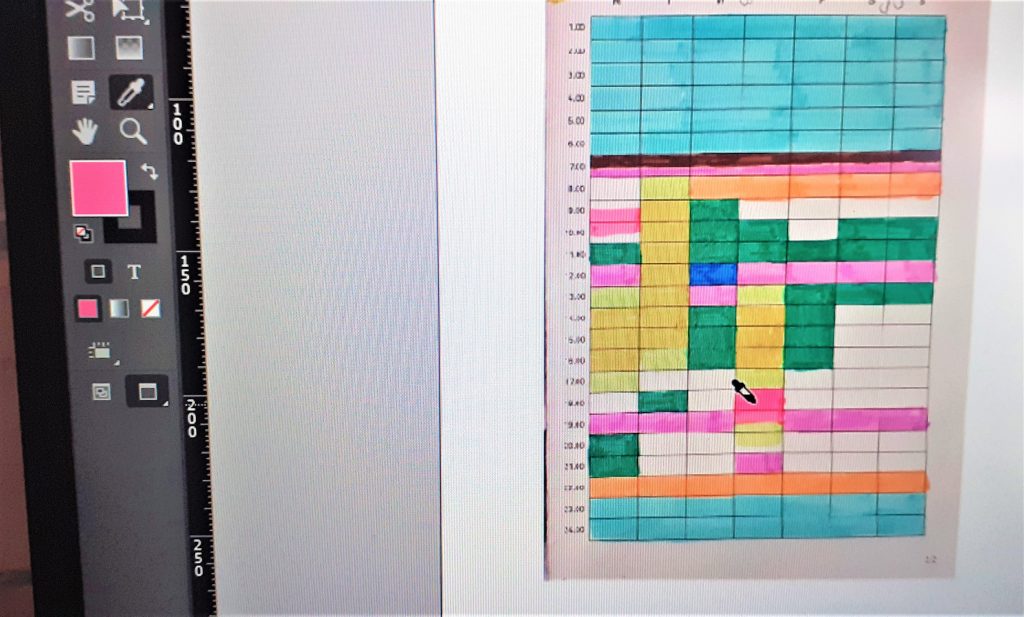
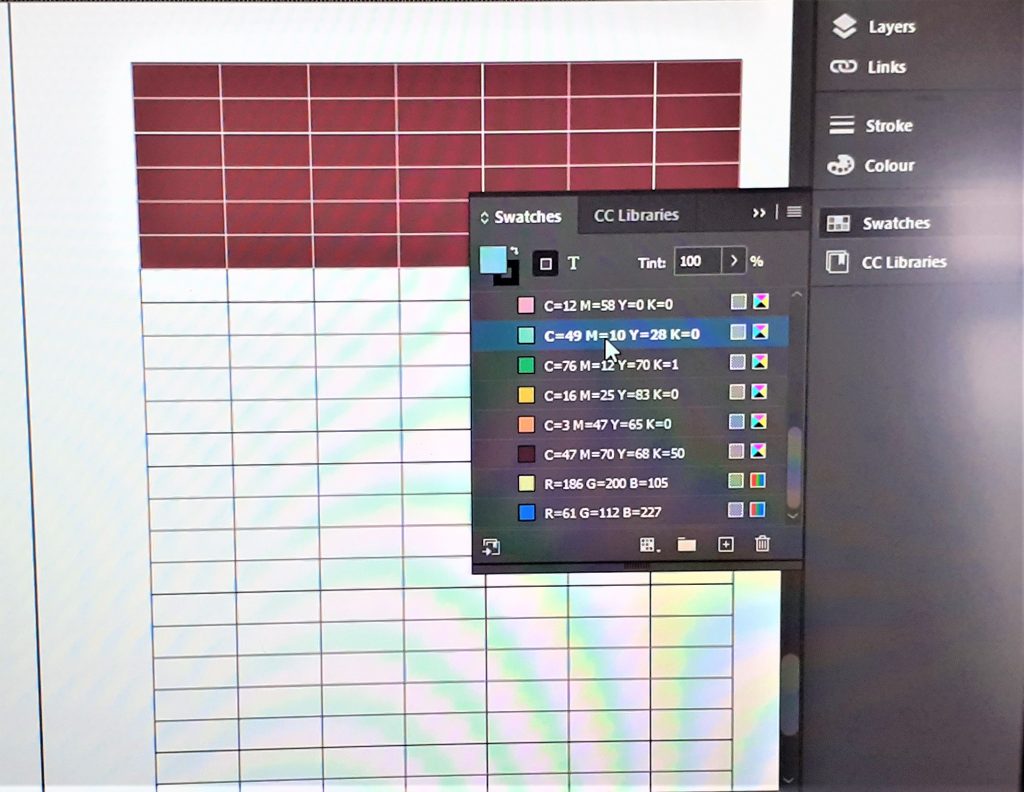
I needed to use the eyedropper tool to select the colours from my scanned image.
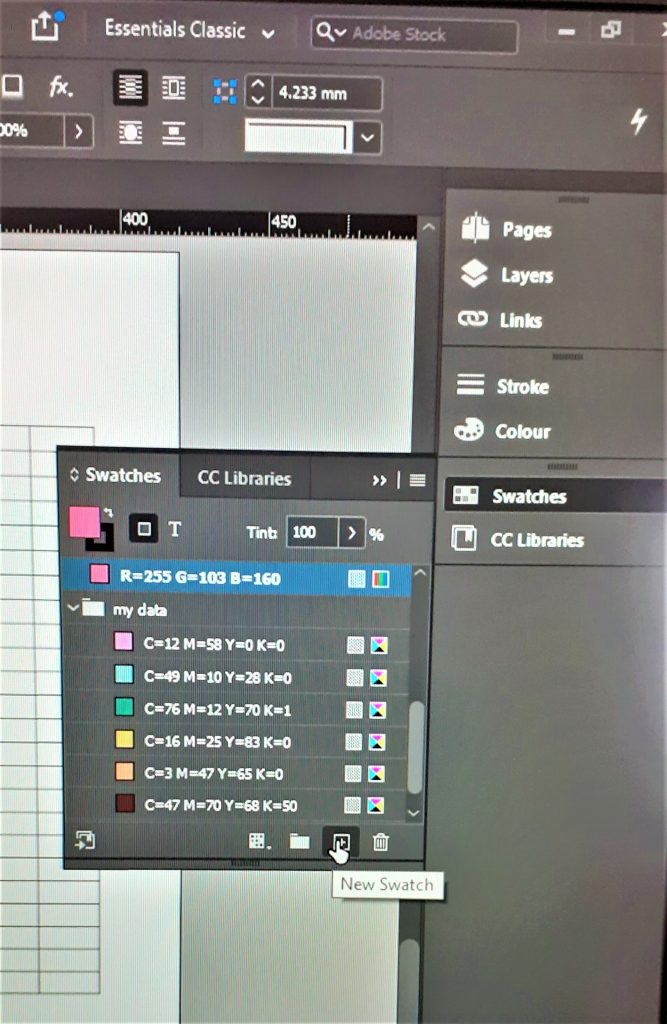
I added this colour to the swatches by selecting ‘New Swatch’.
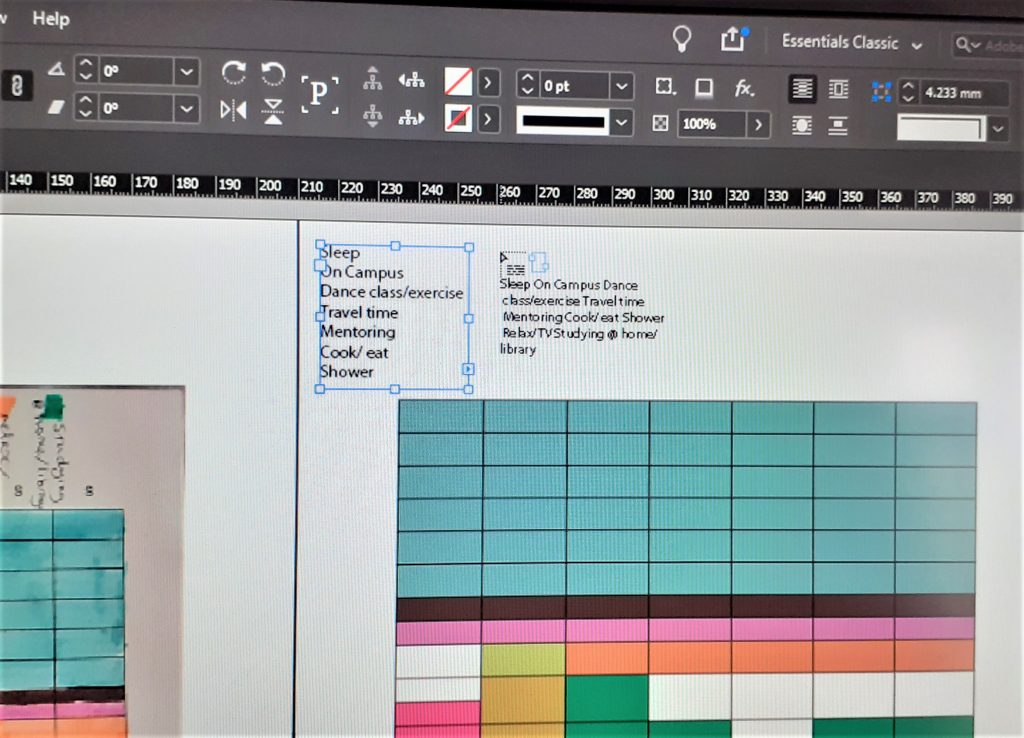
I wanted to add a key to my timetable. I typed the words in a list above the table. The list was too long for the box. This meant that a small red square appeared to tell me there is not enough space for the words. I clicked this red square and selected another area to place the words. I placed them in a box next to the first box.
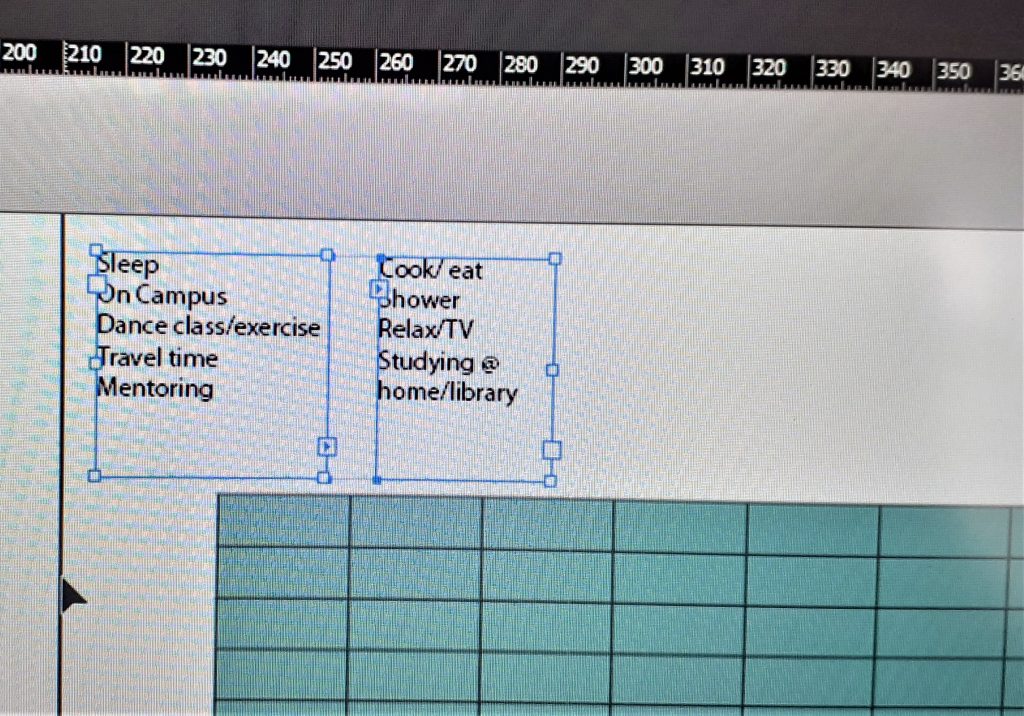
I wanted to change the font to the style I was using for the process book, ‘body copy’. To do this I needed to select the text. I clicked on the first text box, pressed down SHIFT, then clicked the second text box. This meant that both boxes were selected.
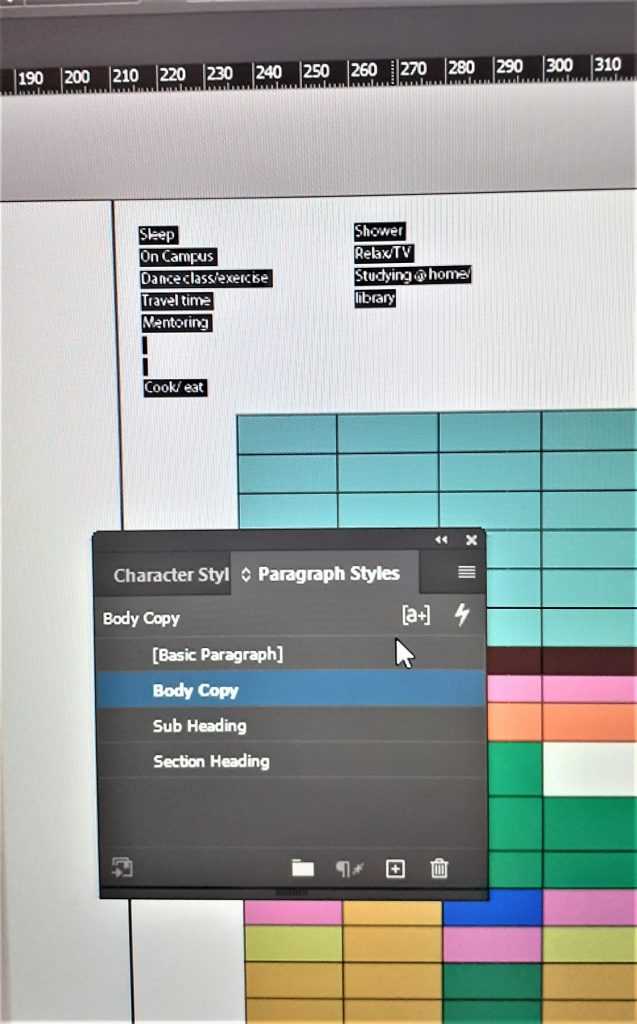
With the text highlighted, I opened the ‘Paragraph Styles’ tab and selected ‘body copy’.
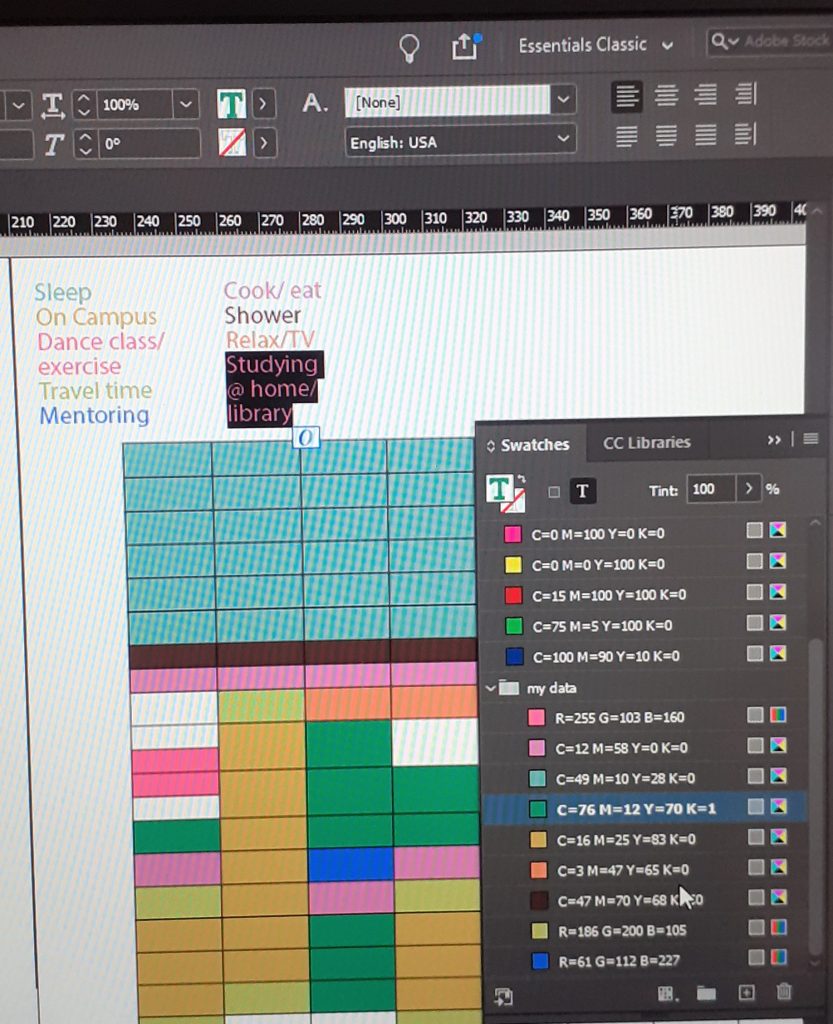
I highlight each word, one at a time. I then changed the colours to match the colours they correspond to in the timetable, choosing from the ‘my data’ swatches.
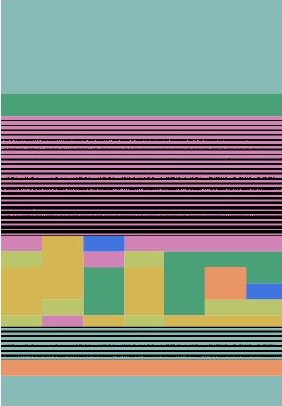
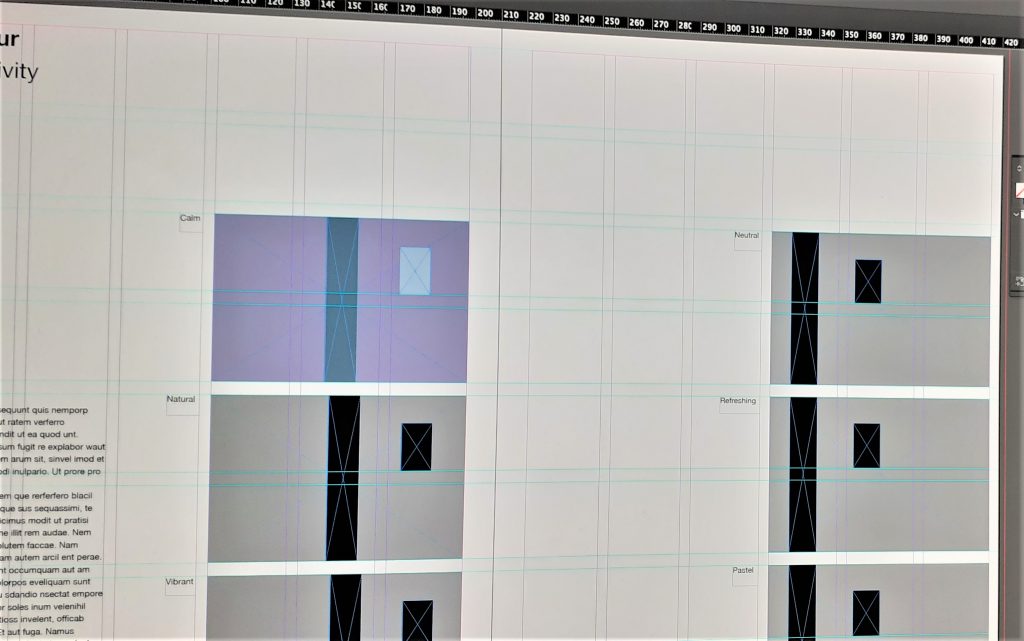
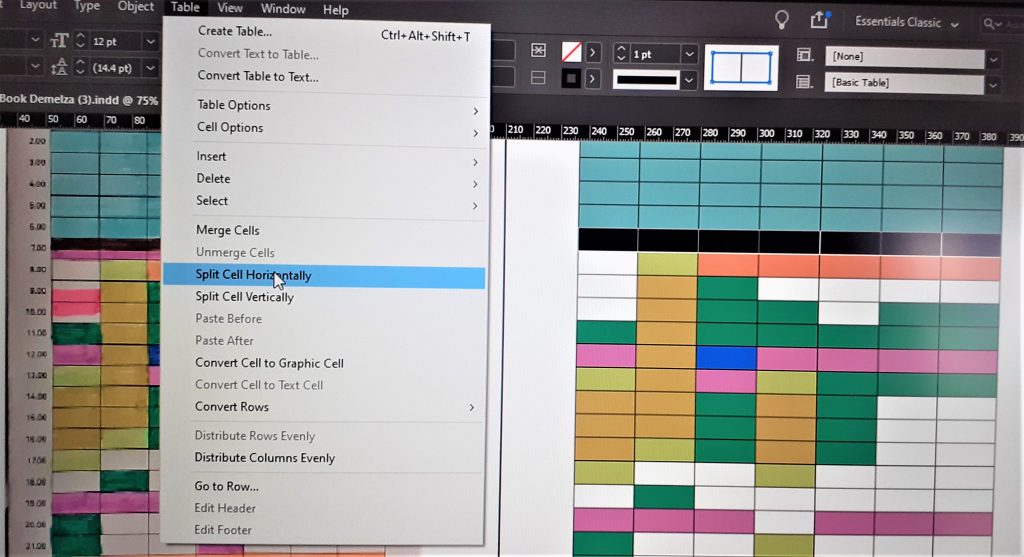
I then used the timetable design as a template for experimentation. I played with merging cells, inserting images, bitmap images and adding colour.