Putting together a presentation

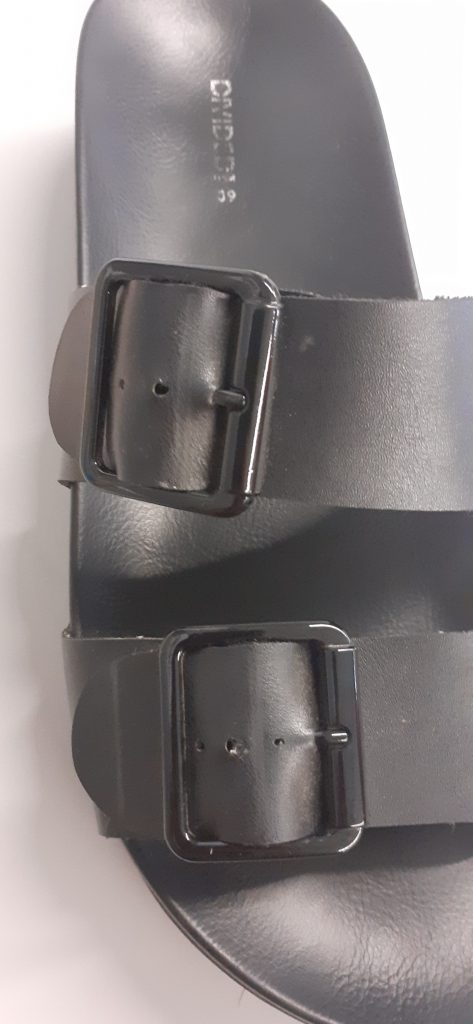
The purpose of today’s lecture was to get us thinking first about the images we choose to present in the presentation and secondly, the order we place them in. To practice piecing together a presentation using InDesign, I chose to focus on my shoe as my object.

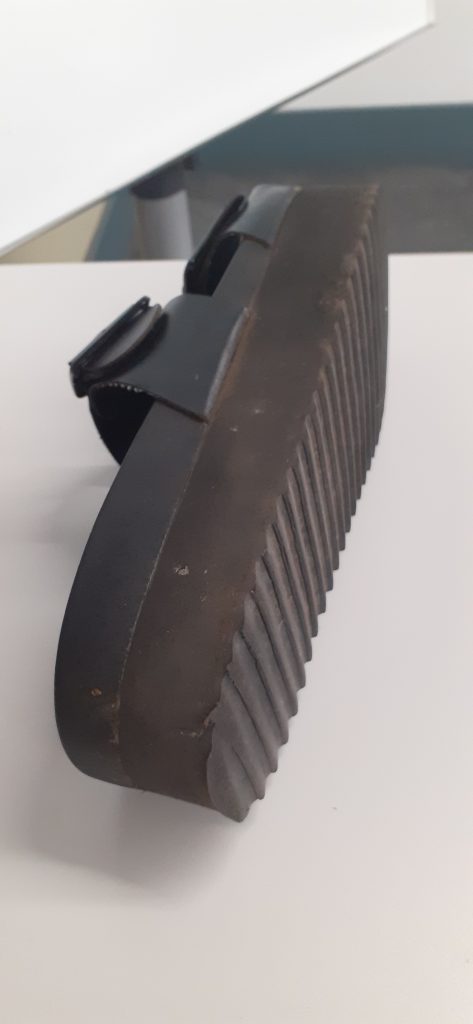
I took photos that showed off the aspects of the shoe I have experience since buying them last weekend: They are tall, they are comfortable to stand in, they can be unstable to walk fast in, the straps can be adjusted. Photographing the shoe on the carpet puts it in the context we would expect from a shoe, which is that it interacts with the ground we walk on.

I then needed to choose 6 of these photos and decide on the best order to present them in. I chose the ‘selling view’ because it shows the entire shoe. I came to realise, this was the exact reason I should not choose that picture to be placed first. Throughout the lecture, I saw that it was more important to leave some mystery for the viewer. If all the information is given away in the first slide, it leaves nothing to be revealed. Instead, it is important to grip the viewer. This is why I rearranged the image of the detail to start the presentation.

Luisa asked us to write 1 word to go with each picture. This was my original order and name for the images.

  1. (selling) view
  2. (wearing) it
  3. seeing the (side)
  4. it’s (comfortable)
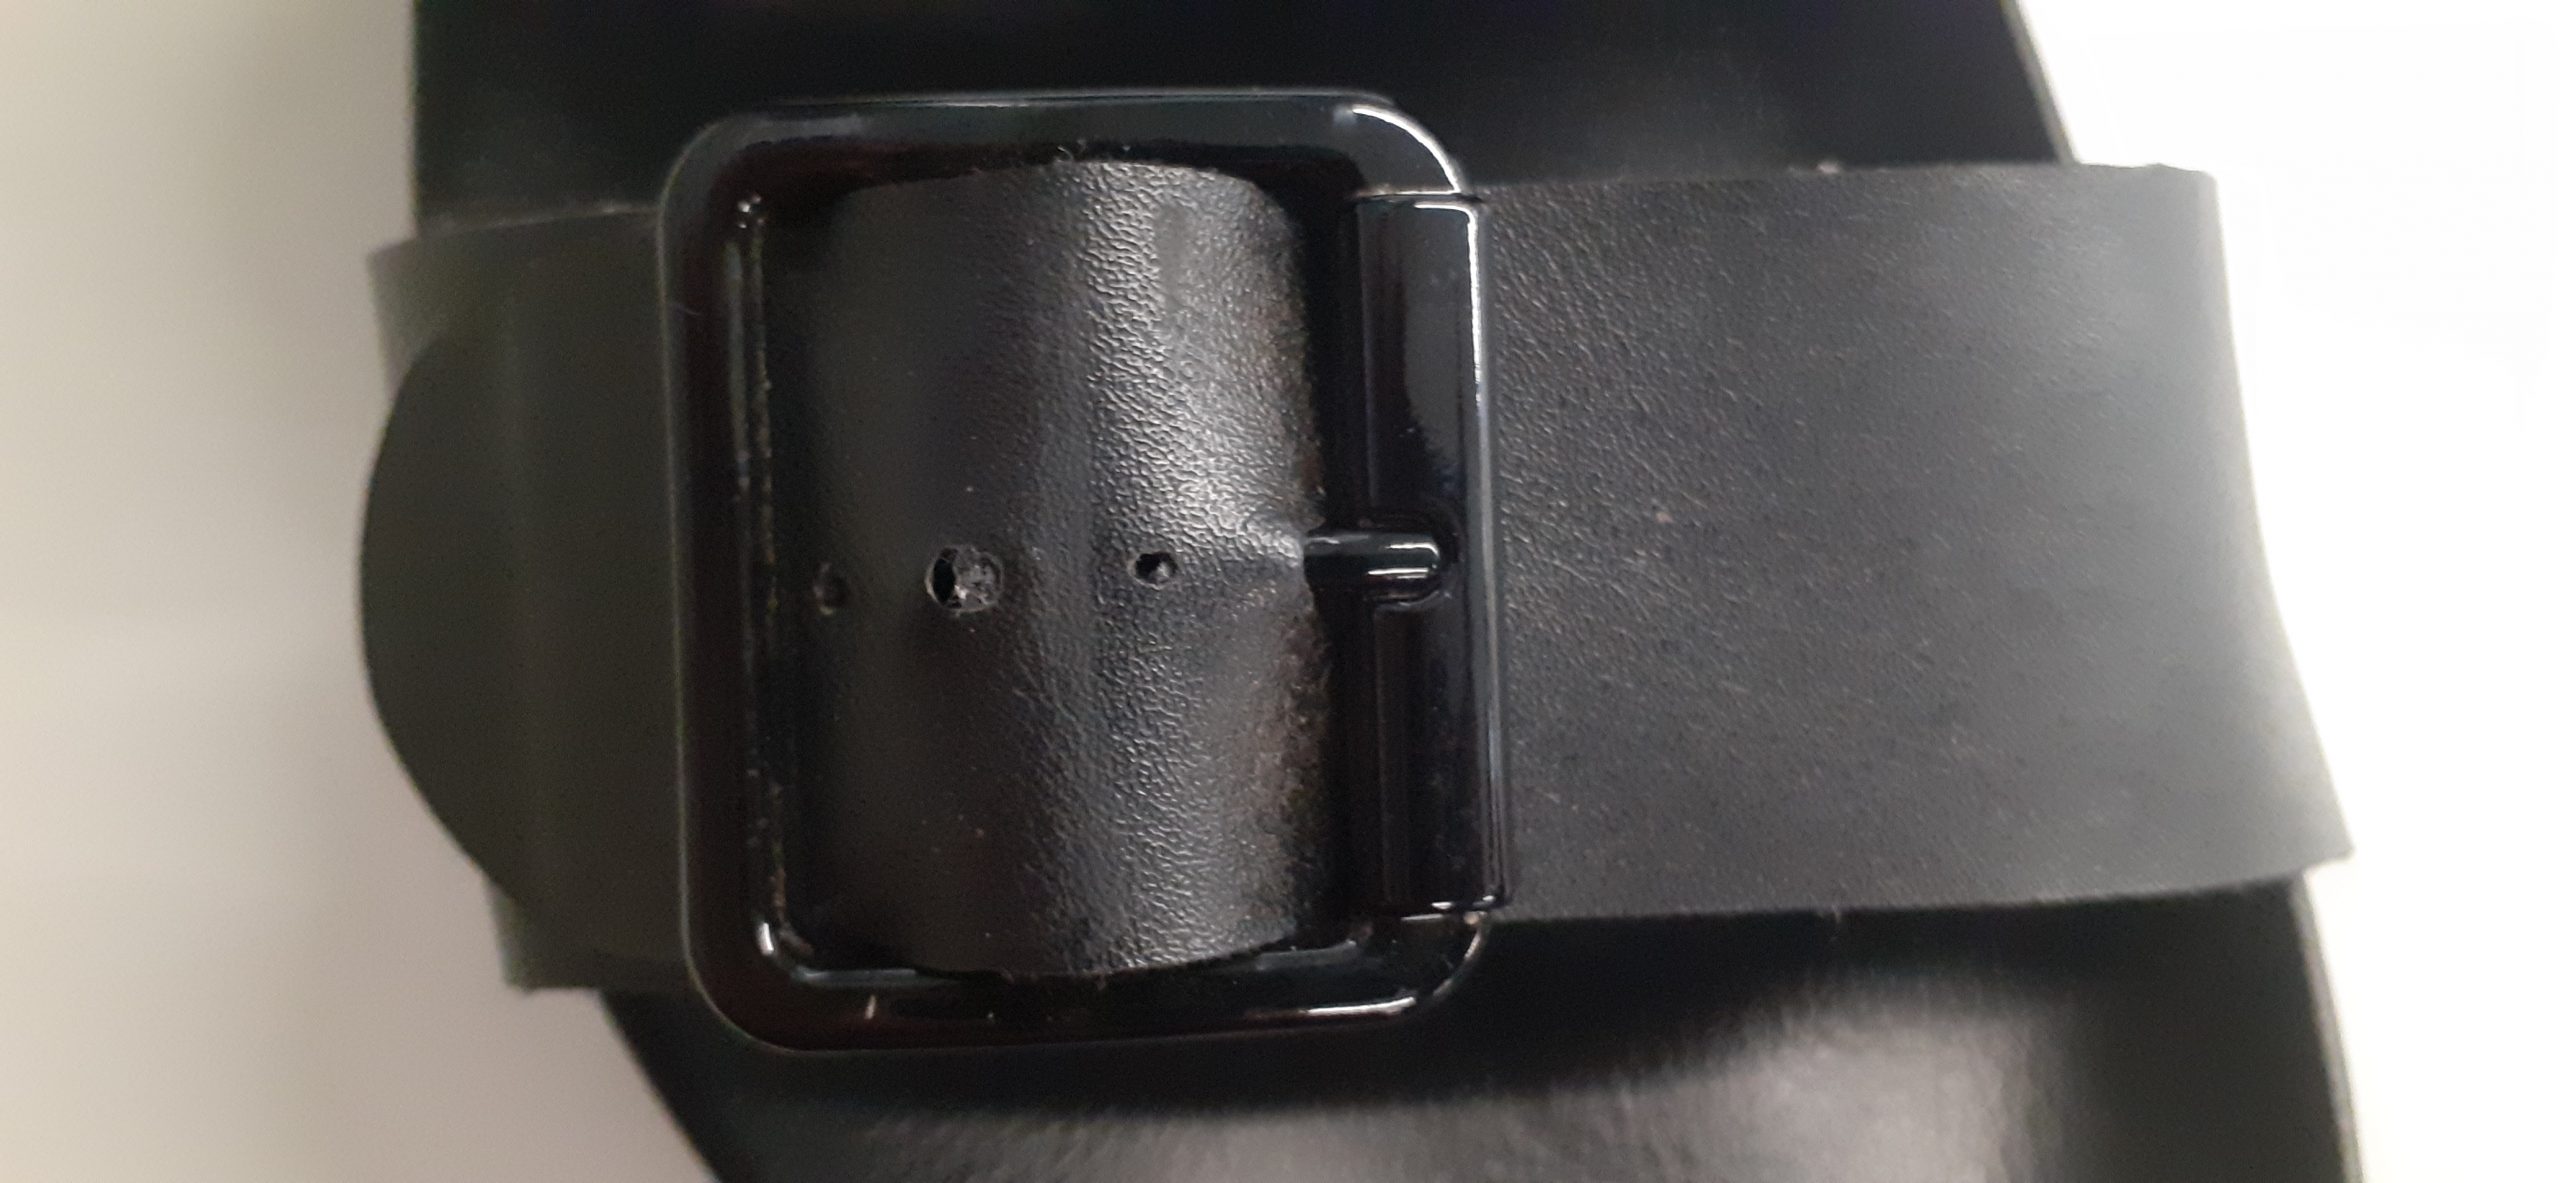
  5. detail of the (buckle)
  6. view from (above)

I approached this task by naming exactly what was in the picture. However, I found that it was more interesting to approach the words creatively. For example, picking out one detail within the image or maybe the material the object is made of. We worked as a group to brainstorm words that relate to each image.

The ‘selling’ and ‘wearing’ slides work together, because the viewer can compare seeing the shoe with and without the foot, since the shoe is placed in a similar position.

The ‘comfortable’ and ‘selling’ slides make sense together because they are both in portrait orientation.

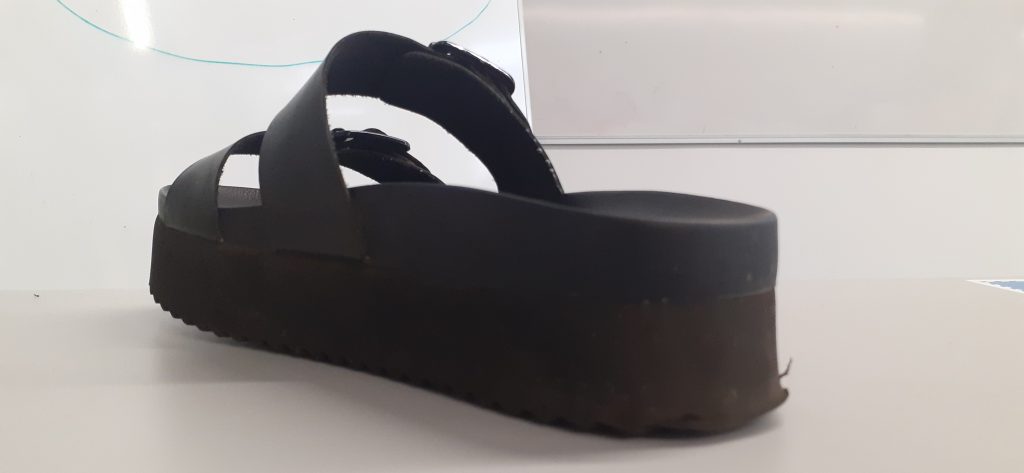
The photos I rejected:
Ball wall clock presentation

The essays by Roland Barthes introduced me to the idea of personifying an object. Often we give objects human qualities, and that is why we become attached to them.

In terms of my presentation, I want to consider the clock in this way? If it was a person, would it be friendly?

What makes a presentation visually ineffective?

Firstly, a presentation is to be seen from afar. There is no point to include graphs or images cannot be seen on the board from the back of the classroom.

Do not include pixelated images. Sometimes an image can become pixelated after you export it to a PDF.

Hierarchy is important. The viewer needs to be directed to the most important information on a page. We can do this by underlining words and adding titles. A text heavy slide is off-putting.

Other presentation tips…

It is a bad idea to be repetitive in a presentation. If an image says the same thing as another image, it is best to remove it. You do not want to bore the audience!

I could drawn my object if I feel it would help to tell the story.

Be playful, anticipate what is going to be in the next slide.

Not all the images need to contain the object. A photo of the building tells as much a story about my experience of the object.

I could include an image of the clock selling on a website. This is part of the story of the object’s value.

I can show the object in different contexts, for example in the museum or in a catalogue. This shows how the object appears in our world.

The final picture has to surprise the viewer and sumarise the object.
Museum of the Ordinary

The study of Semiotics suggests that who is reading the image, is important in determining the message. Semiosis is the process of How we take meaning from a sign. Roland Barthes was a French literary critic and philosopher. He felt that the meaning of words as well as images are dependent on the viewer.

Denotation= The literal or primary meaning of an image.

Connotation= This is the meaning of a sign depending on our interpretations. This means the connotation is something that always changes.

Ways of Seeing- John Berger

As mentioned in a previous blog post, Writing & Research Skills. John Berger wrote a book and BBC documentary entitled Ways of Seeing, in which he discusses semiotics:

‘We never look at just one thing; we are always looking at the relation between things and ourselves.’

‘The way we see things is affected by what we know or what we believe.’

John Berger, Ways of Seeing

‘The photographer’s way of seeing is reflected in his choice of subject. The painter’s way of seeing is reconstituted by the marks he makes on the canvas or paper.’

In this quote, he is saying that a photographer is selecting and bringing attention to an element. He/she is showing something about their perception within this photo. A photo cannot be objective if a person is behind the lens.

An example Berger gives in his book is the painting Venus and Mars by Boticelli.


Sandro Botticelli | Venus and Mars | NG915 | National Gallery, London

Isolating a part of the image means you see something differently by the way it is framed.

If we frame just Venus’ face, the image looks like a portrait painting of a young lady. We need to see the painting as a whole to understand the context.

Open work- Umberto Eco

Umberto Eco Was an Italian philosopher, social commentator, and novelist. In his work, he speaks about the Ideal reader. This is someone who is aware of the possibilities of interpretation in a work.

From Visual Signs by David Crow:

  • ‘Eco prefers the term “encyclopedia,” rather than the more common term “code,” to describe the transfer of meaning through the use of signs. For Eco, a code implies a one-to-one transfer of meaning like a dictionary definition, whereas encyclopedia suggests that there are a number of interrelated interpretations and readers must negotiate their own path through the network of possibilities.’
  • ‘It is important to note that he sees information as something different from meaning or message. He suggests that the amount of information contained in a message depends on the probability of the reader’s already knowing the content of the message before it is received.’
  • ‘Eco argues that contemporary art contains much higher amounts of information, though not necessarily more meaning, by virtue of its radical nature. More conventional forms of communication—such as the road sign, for example, or figurative painting— may carry more distinct meaning but much less information.’
  • ‘If a newsflash tells me that tomorrow the sun will rise, I have been given very little information as I could have worked this out for myself. If, however, the newsflash tells me that the sun will not rise, then I have a lot of information as this is a highly improbable event.’
  • ‘Eco also points out that the amount of information contained in a message is affected by another factor: our confidence in the source of the message.’
  • ‘If a landlord were to tell me an apartment had damp problems before I rented it, I would be more inclined to believe him because he has nothing to gain by fabricating this message.’
  • ‘The amount of information is greater when the content or the source is improbable.’
  • ‘”Christmas is an annual festival.” This has a very clear and direct meaning with no ambiguity, yet it doesn’t add to our existing knowledge. In other words, although the communicative value is high, the amount of information is low.’

A piece of discarded material can become an artifact once it has been framed.

Umberto Eco

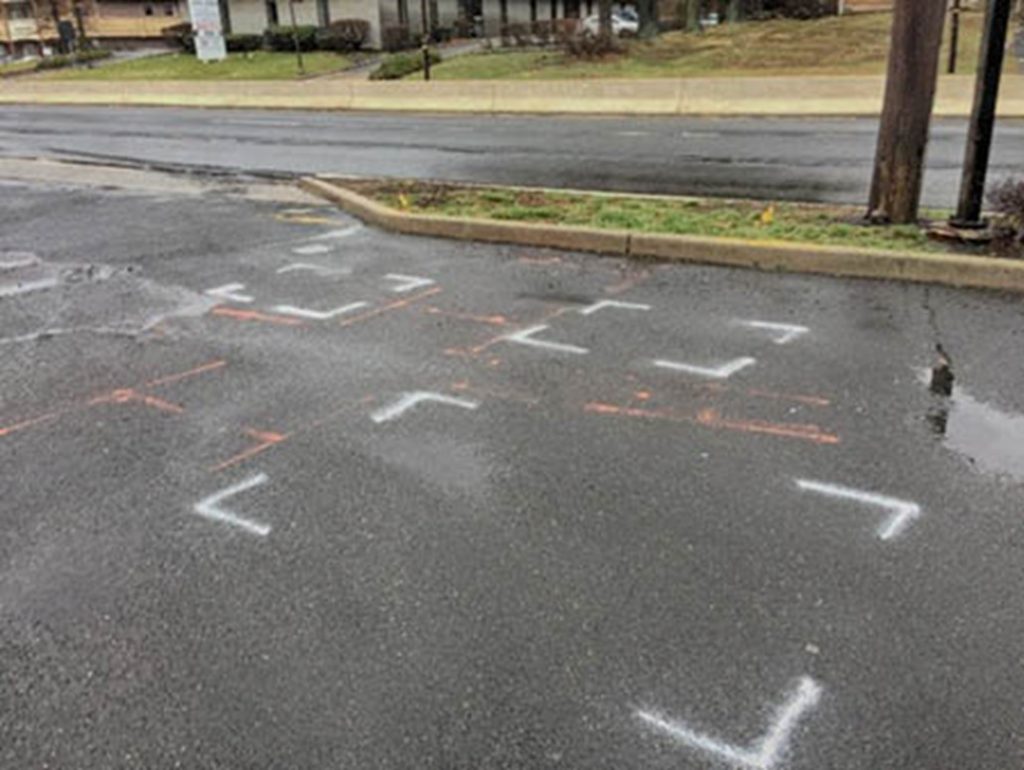
Framing brings attention to something e.g. cracks in the road spray painted to mark for repair. At this location, they have marked areas for drilling into, on the asphalt. This makes us aware of areas and focus on areas we otherwise would not notice.


Ground Penetrating Radar Utility Scanning – East Handover, NJ (gp-radar.com)
Frames within frames

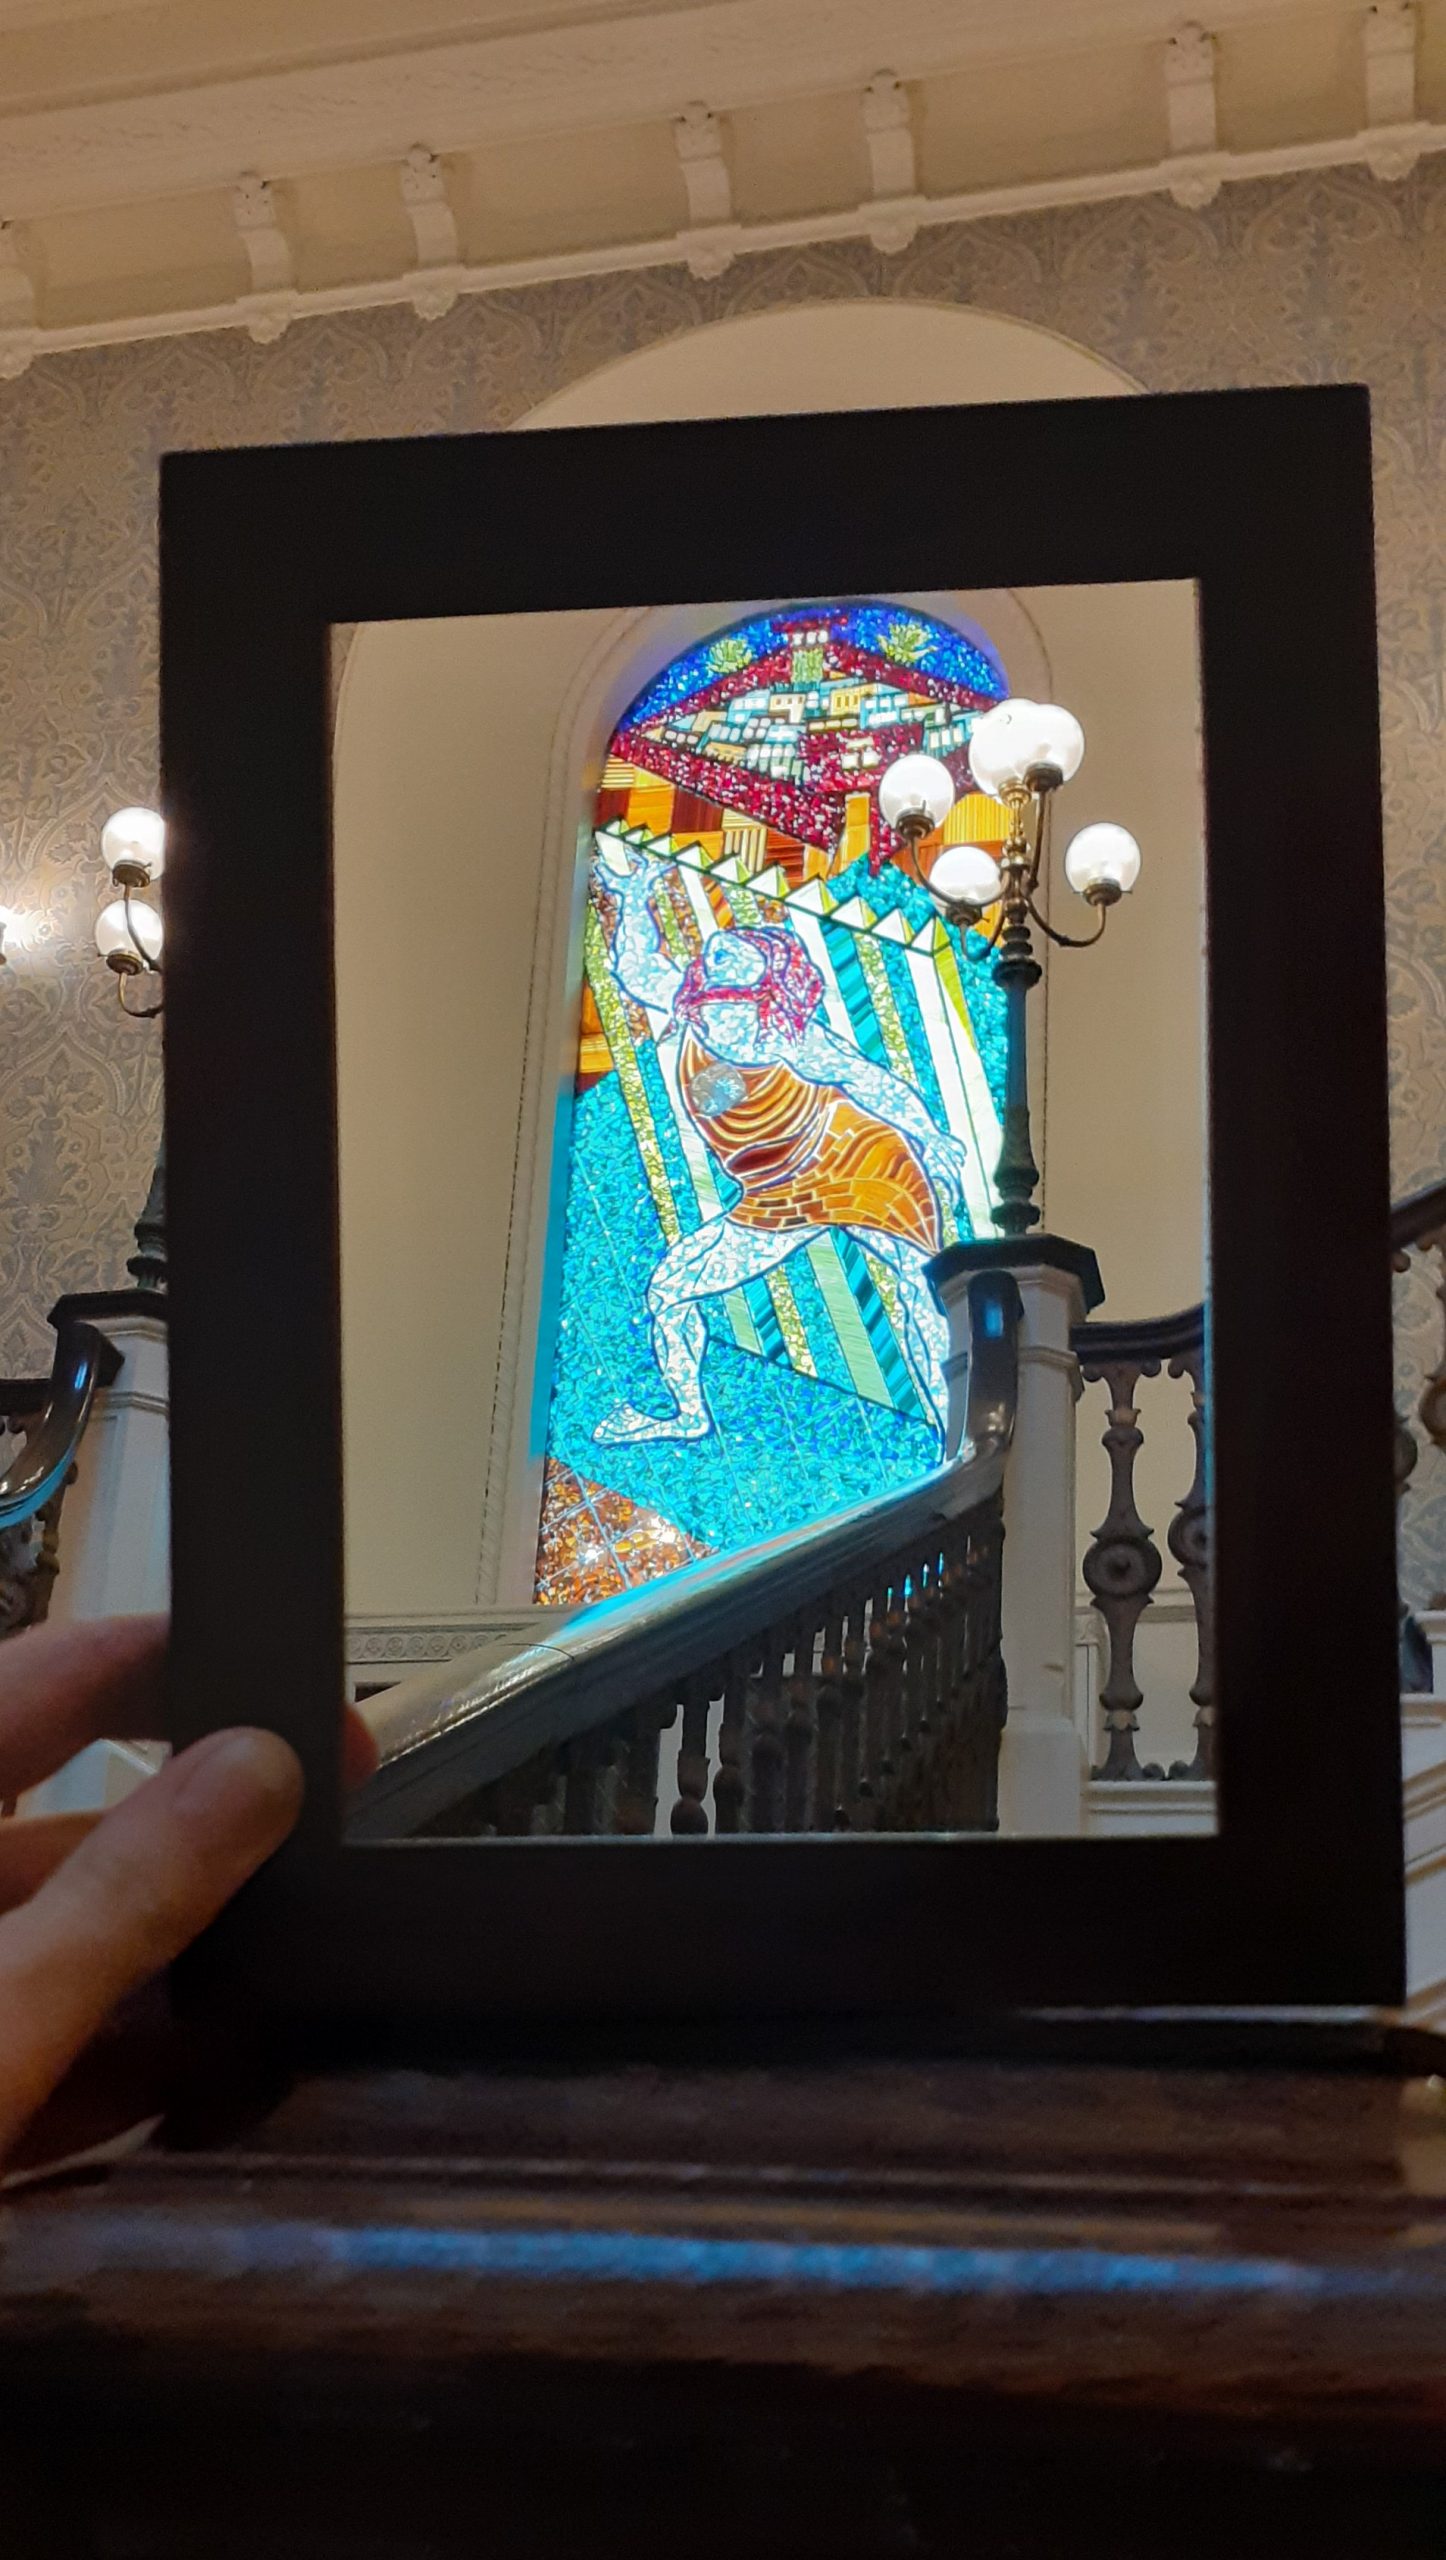
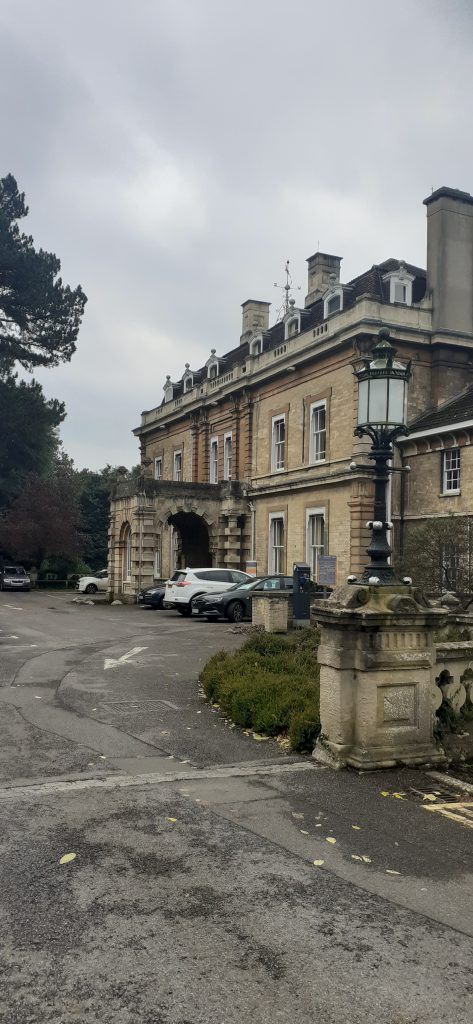
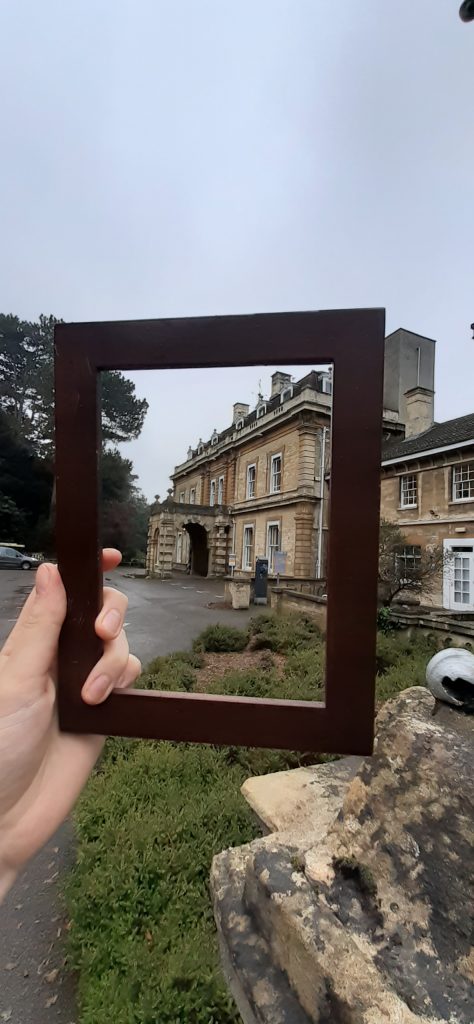
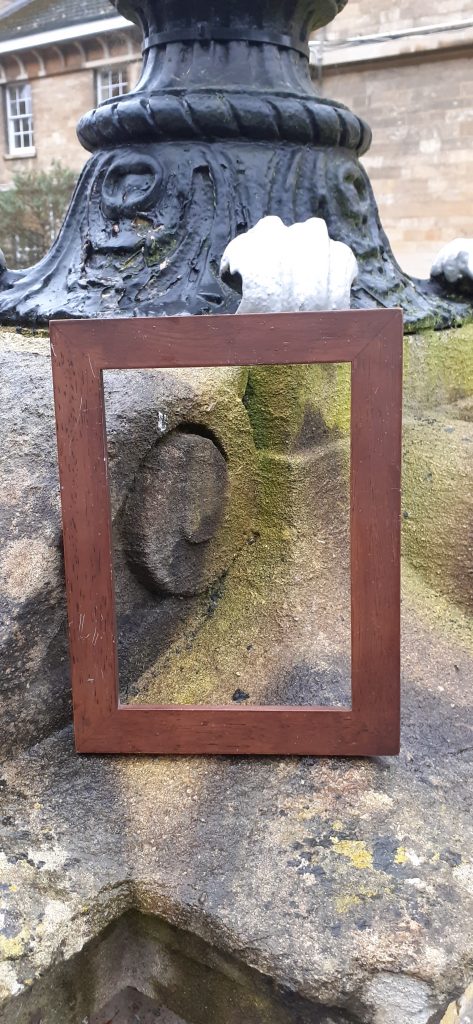
In this week’s workshop, we were taking photographs around campus. I experimented with using a photo frame to draw attention to certain areas and then taking a picture of the same area without the use of a frame. I wanted to see what difference the frame would make.

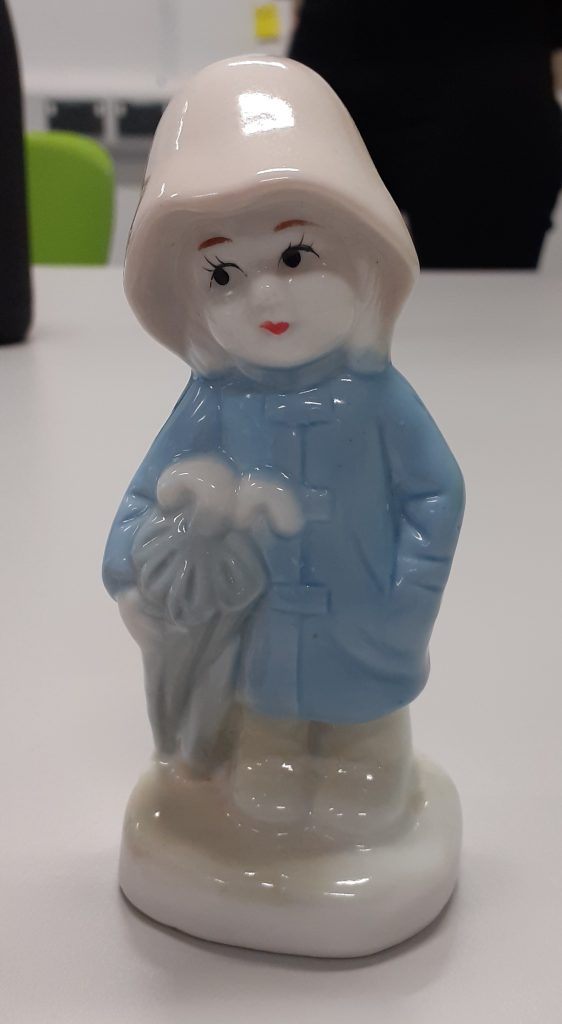
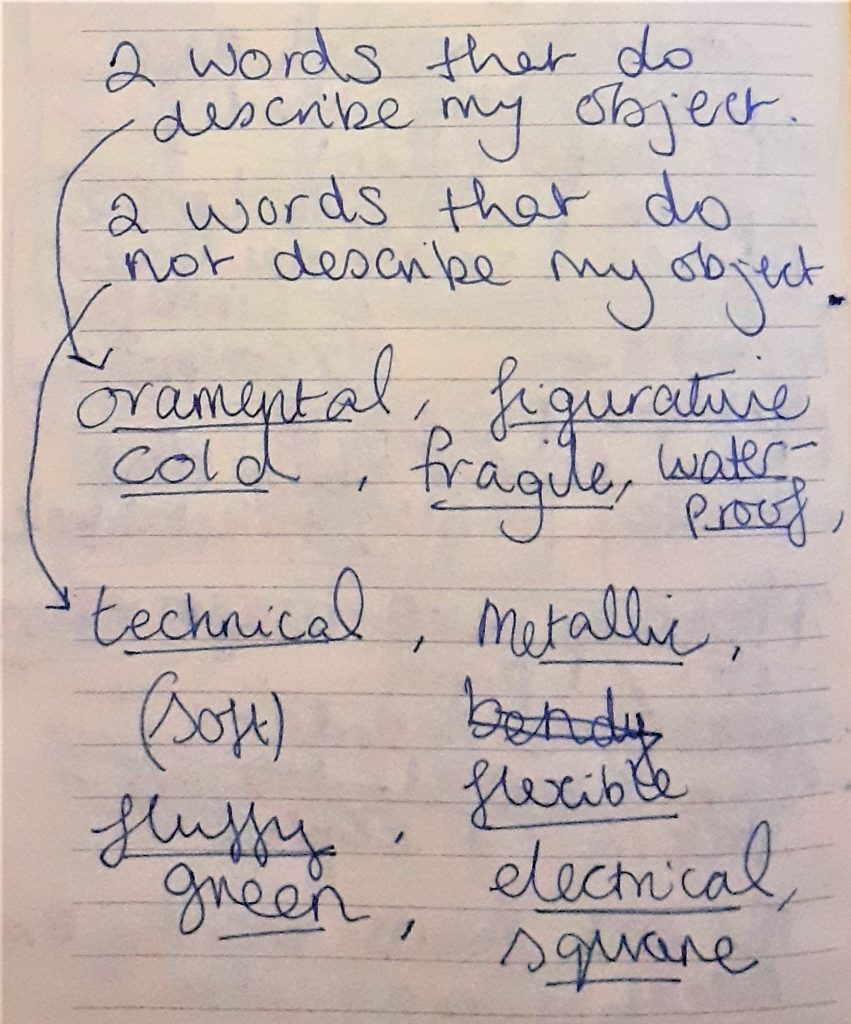
Before the workshop, I wrote down a collection of words that related to my object, The Raincoat Girl. I then wrote words that did not describe the object.
I used these words as inspiration when taking photos around campus. It was challenging to find subjects and locations in a short space of time. (We had around 40 minutes for this task.) It was harder than I thought to find objects I was happy with.

I used the frame to draw the focus to the entrance of the building.

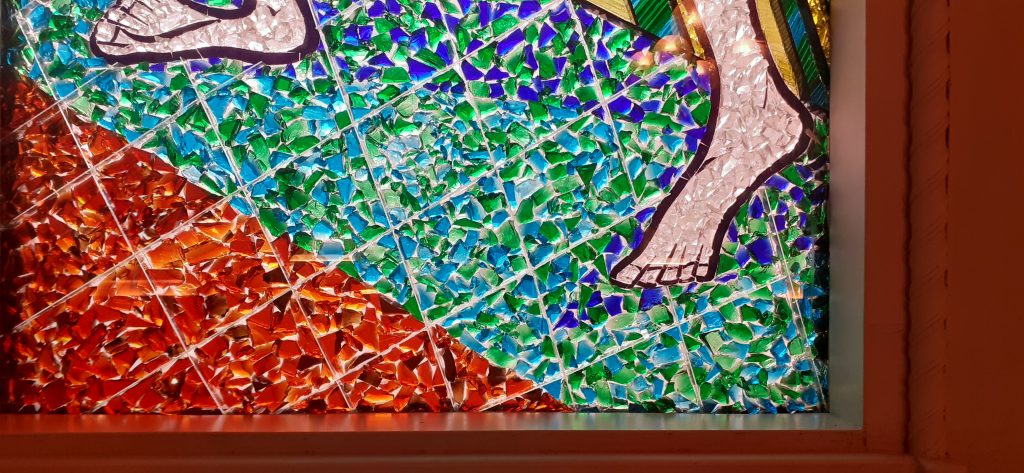
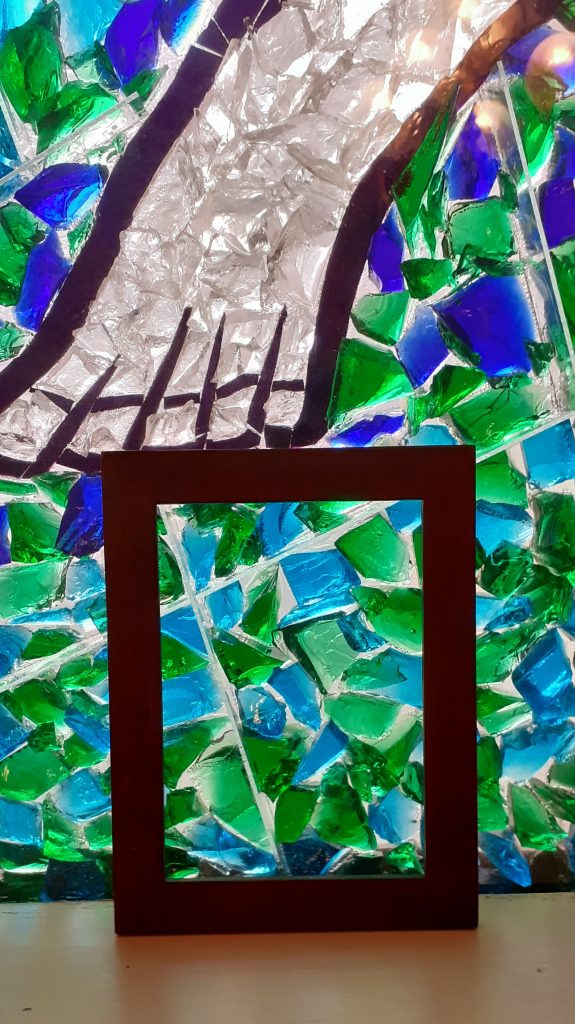
I placed the frame in a place that highlighted the fragmentation of the pieces of glass. I was relating this subject to the word ‘fragile’, since my object is fragile. I chose the blue and green area because my object is blue and green was one of the words I wrote to describe what my object was not.

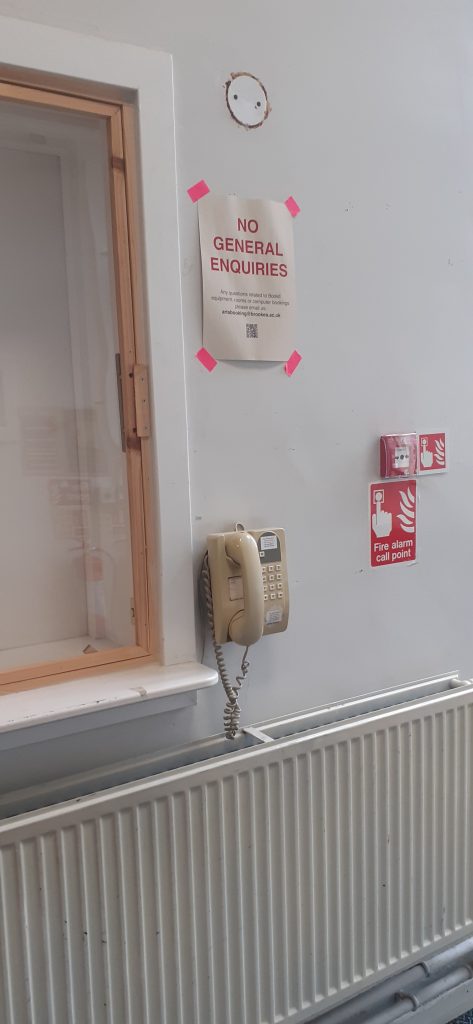
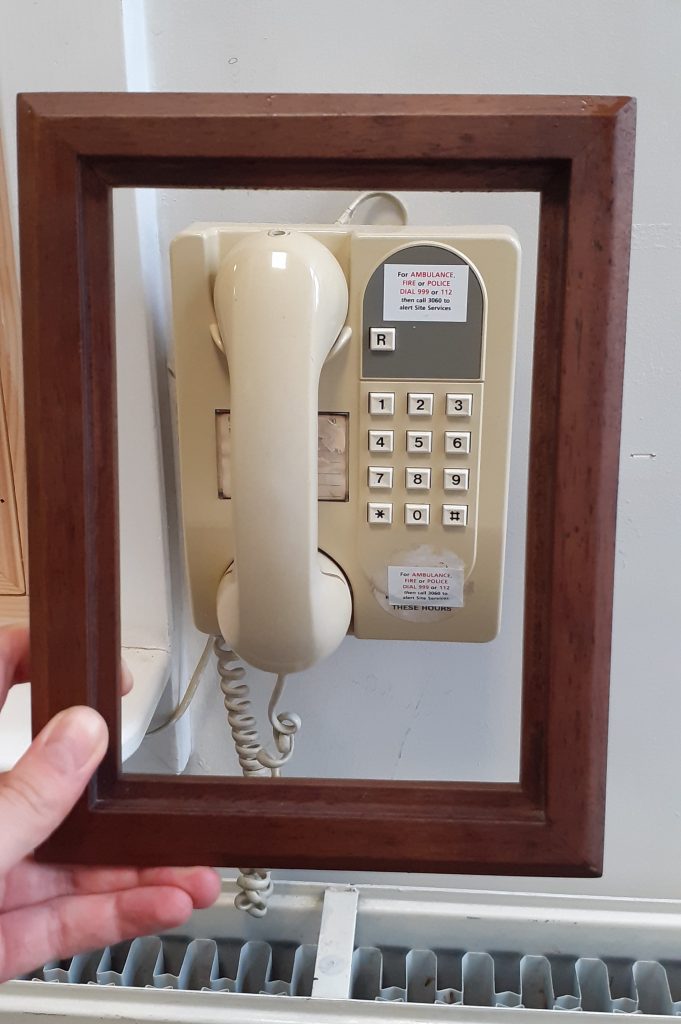
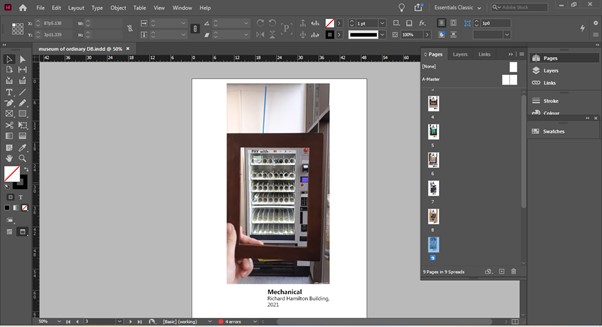
I took this photo in the Richard Hamilton Building on campus. Two objects here are used for communication: a telephone and a fire alarm. Both objects are useful and even essential. I found that this contrasted with my object which is purely decorative and does not serve any vital or important purpose.

I chose to focus in on one object. I found it interesting that the phone looks old fashioned and would look at home beside my object. even though their functions are very different.
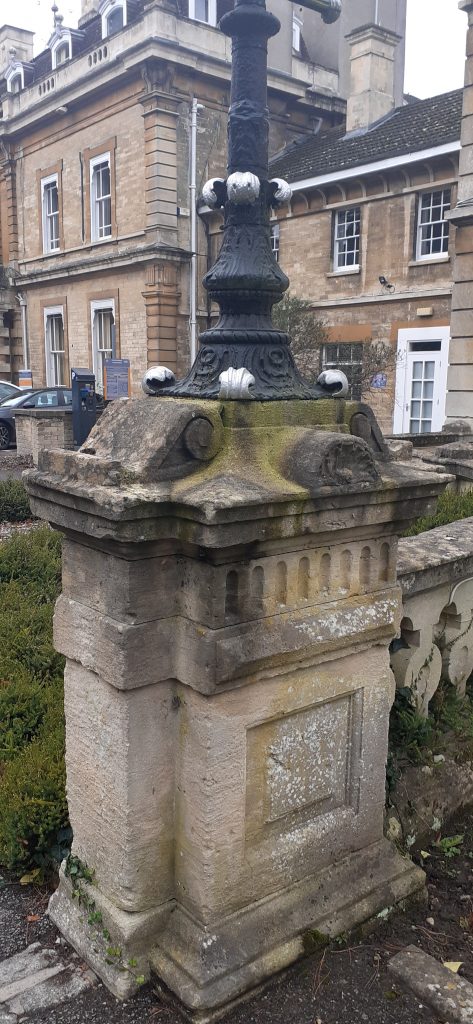
There is a lot going on in the design of this post at the exterior of Headington Hill Hall. It is old fashioned and decorative, like my object.
Framing one area of the pillar helps to focus in one one element of the design.

After taking the photos, we needed to place the photos in an InDesign document. InDesign was suitable because we needed to then add labels next to each photo. The label resembled the caption placed next to an artwork in a museum or gallery. It was fun to see the photos presented in this way. I liked the addition of the word next to the image as a title because it added more meaning to the image and helped present the message I had in mind when taking the photo.
InDesign process

I selected File>document set up. This gave me the option of choosing the number of pages in the document. In the same window, I could also unselect facing pages. This meant that I could view one page at a time.

I could use the page tool to change the page’s orientation, if one of my photos happened to be in a landscape orientation for example. This option is located at top of the page.

(The document needs to be on essentials classics for me to complete these steps.)

If this is not switched on, I can change this by selecting Window>workspace>essentials classic.

File> place to place an image in InDesign.

Digital Workshop- (Week 3) Working with Colour

From week 1, our digital workshops have been spent building up process books. These books give us somewhere to record the new skills we are learning in module 002. (Skills in screen-printing, bookbinding and in digital design software.) I have a feeling these 3 areas will soon come together…

In this weeks’ workshop, we focused on colour. I’ve learnt a bit about colour swatches in Adobe InDesign. Colour swatches are similar to the painter’s palette I am used to, only digital. I have found this process satisfying and much easier than I thought it would be! Computers have improved a lot since I left school 10 years ago.

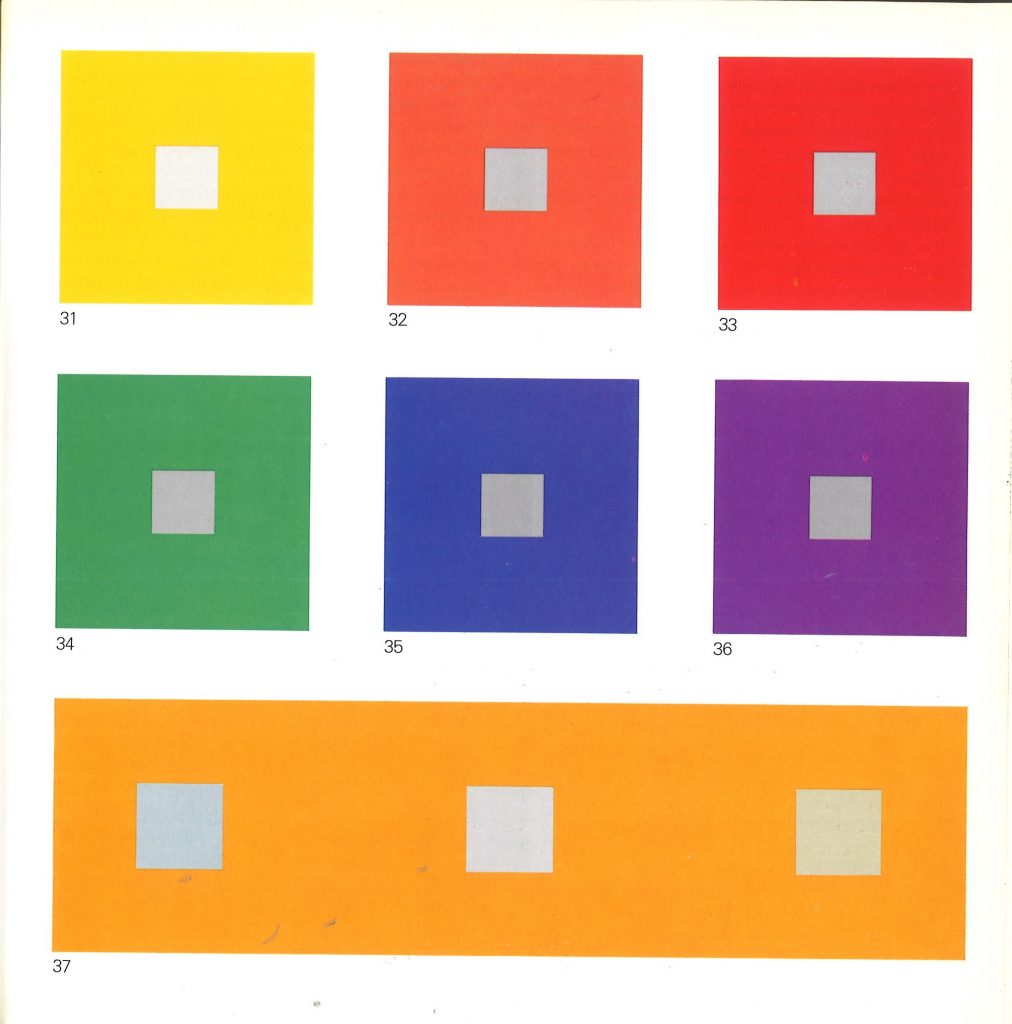
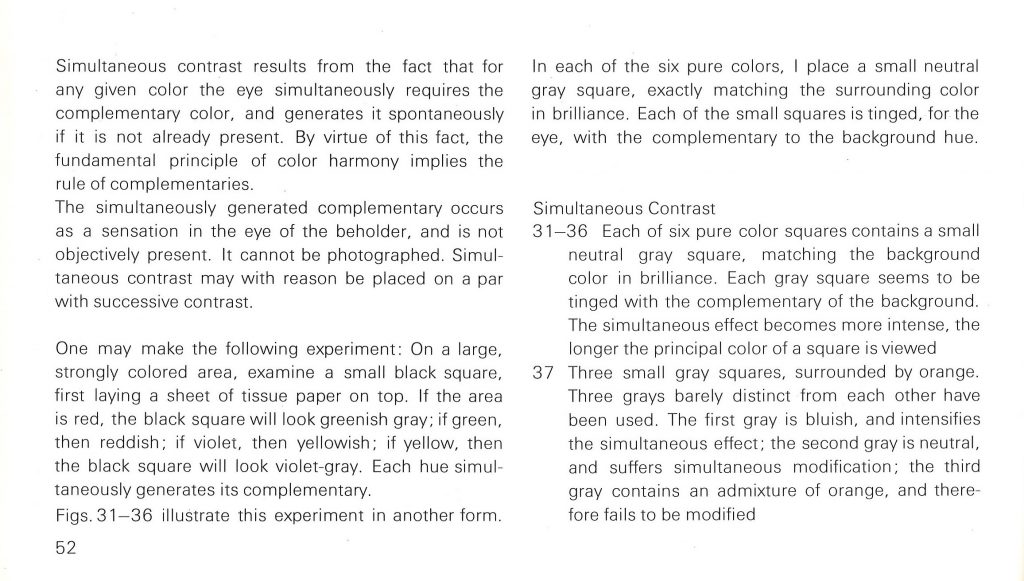
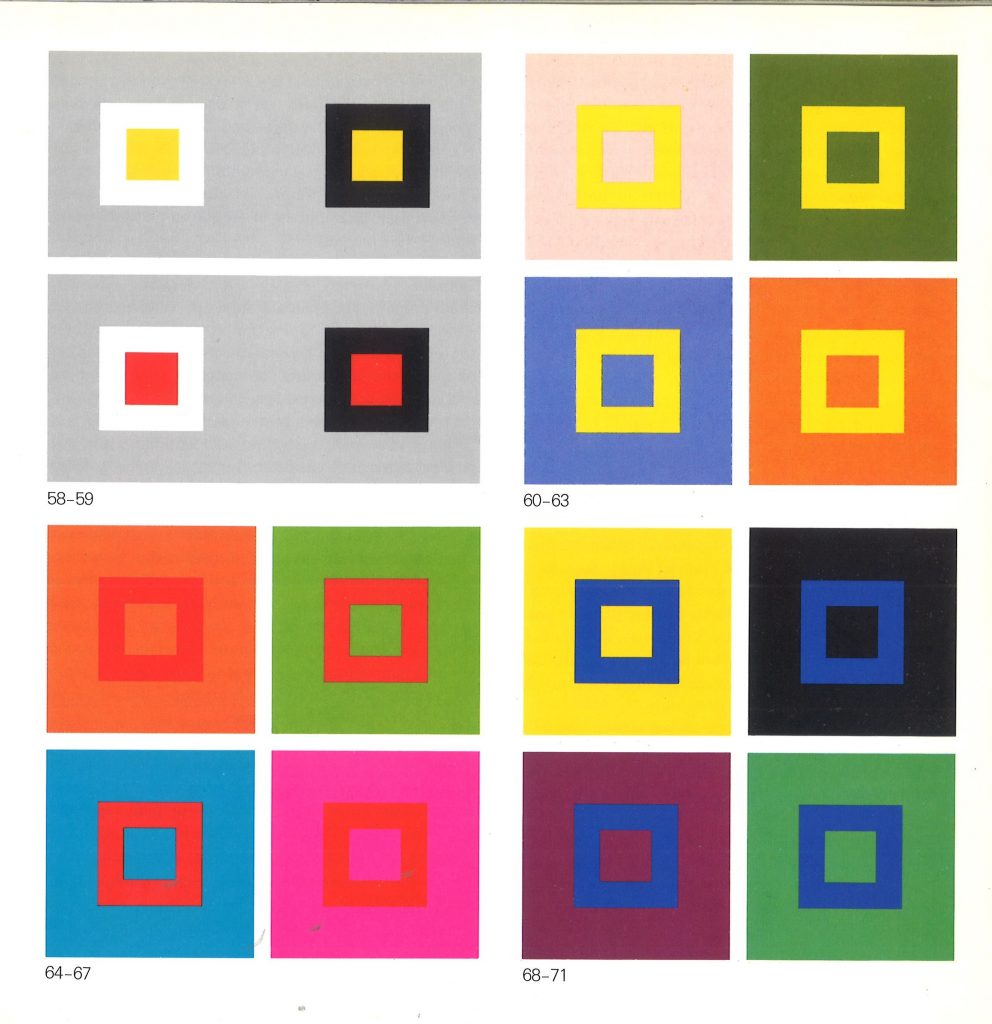
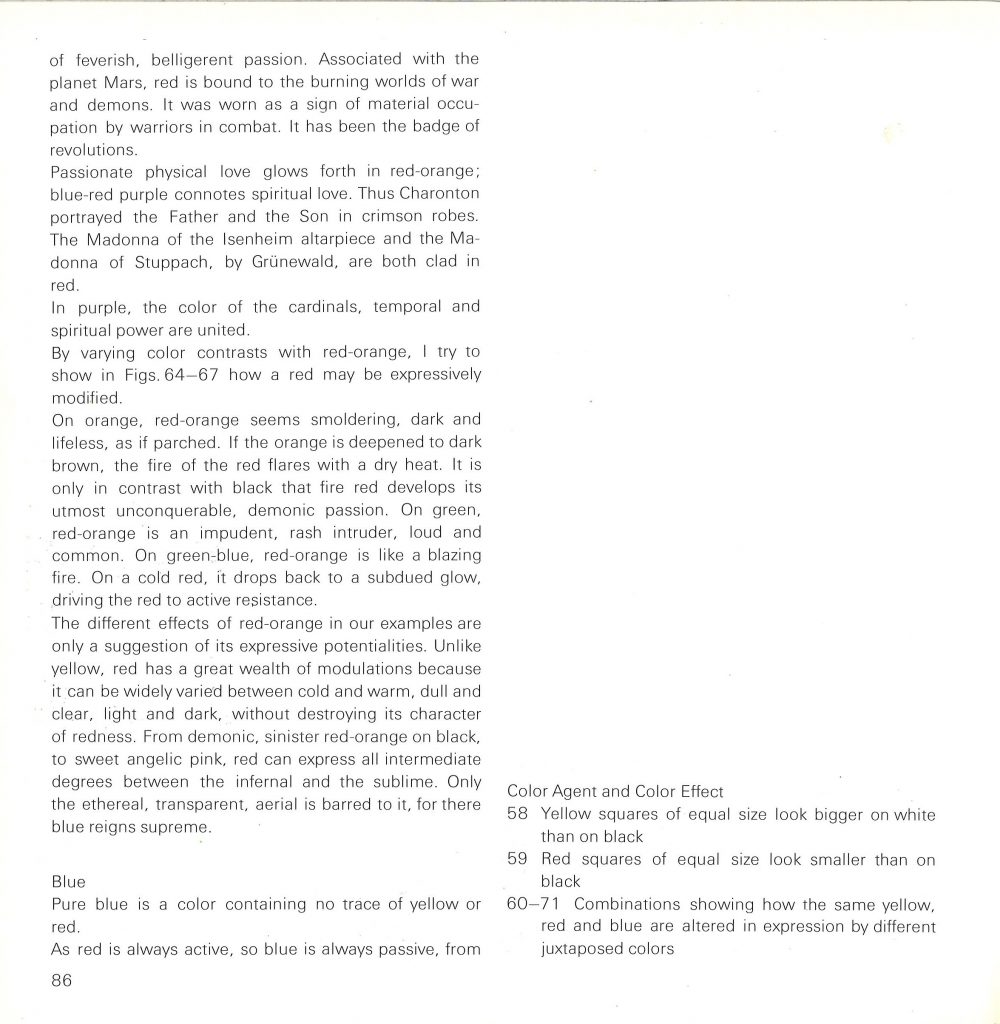
Our lecturer Adam mentioned colour relativity. At college last year, I completed a project based on the work of Josef Albers, famous colour theorist and fine artist. He spent his life exploring the relationship between colours. I took a trip to the library and came across The ELements of Color by Johannes Itten. It is a handy paperback book that explains colour relativity in simple terms:

From The ELements of Color. The grey square at the centre appears different depending on which colour it is placed against.
The same colour is placed on a series of coloured squares. The result is the illusion of a variety of depths.
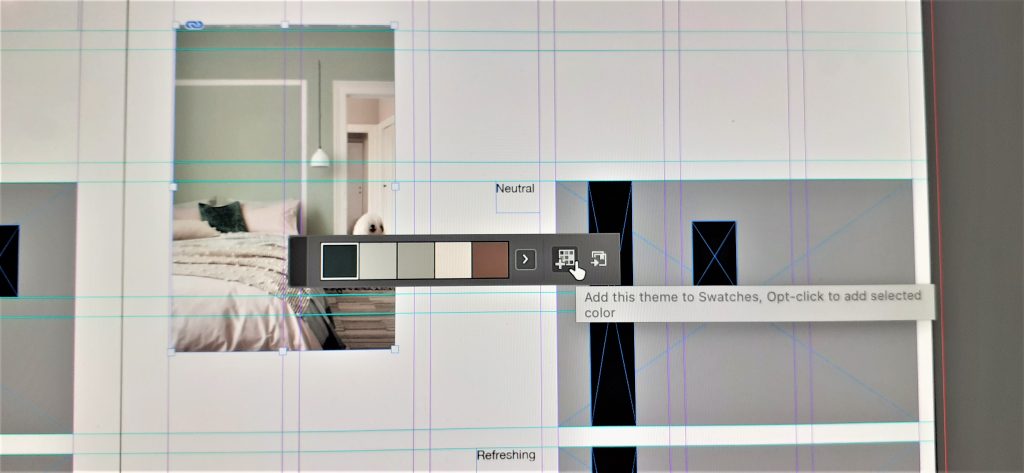
(In InDesign) The colour theme tool allows me to create colour swatches from the colours within any image.
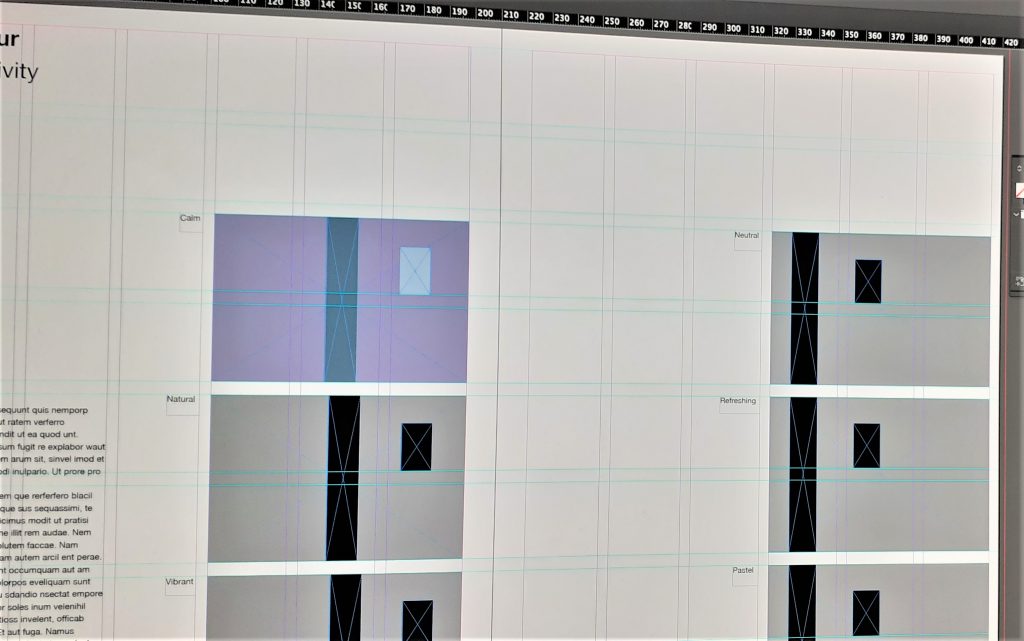
I was then able to add these colours to the process book, taking them from my swatches. I created different themes such as ‘calm’, ‘neutral’ and ‘vibrant’. I placed them within rectangles that I drew using the rectangle tool.

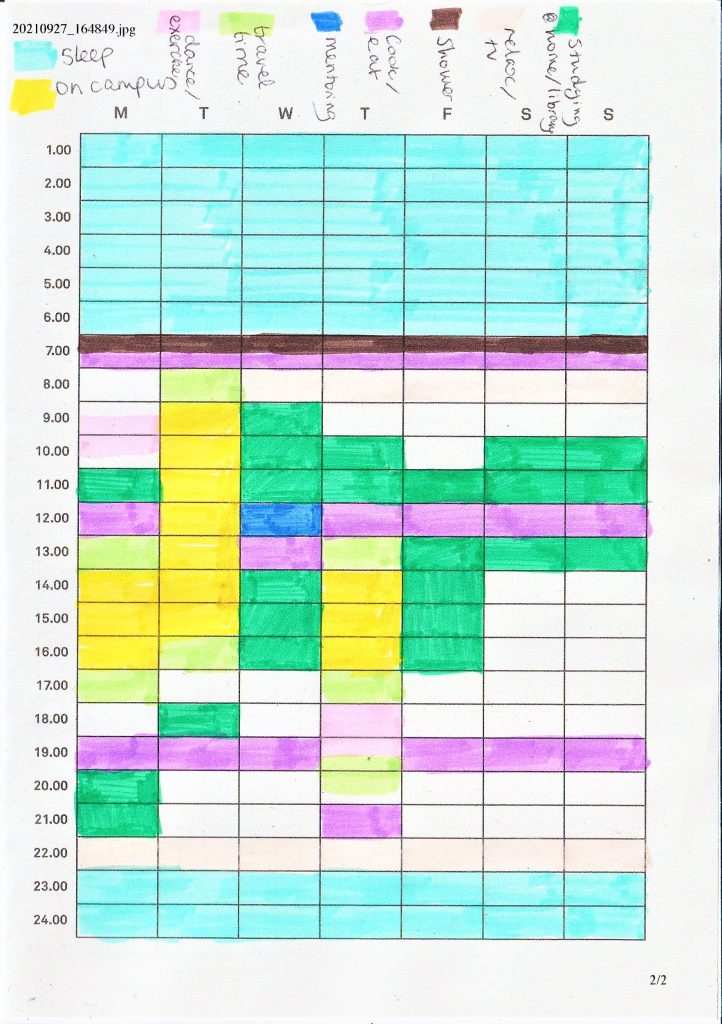
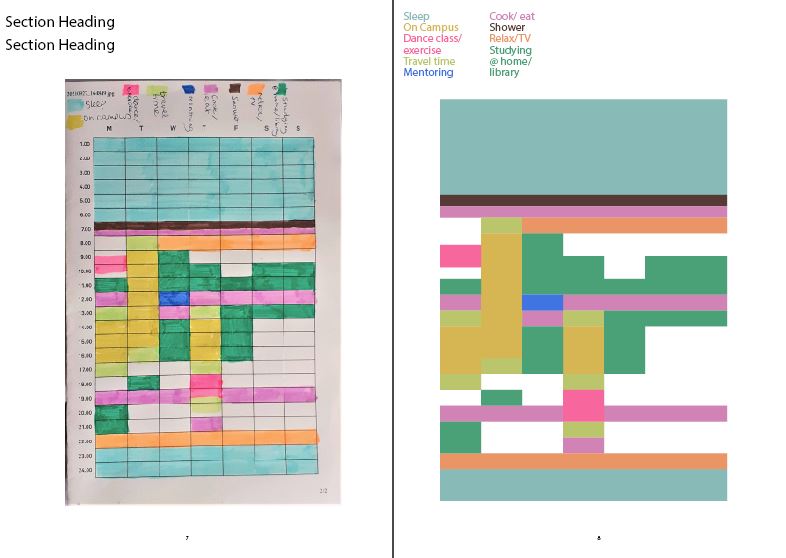
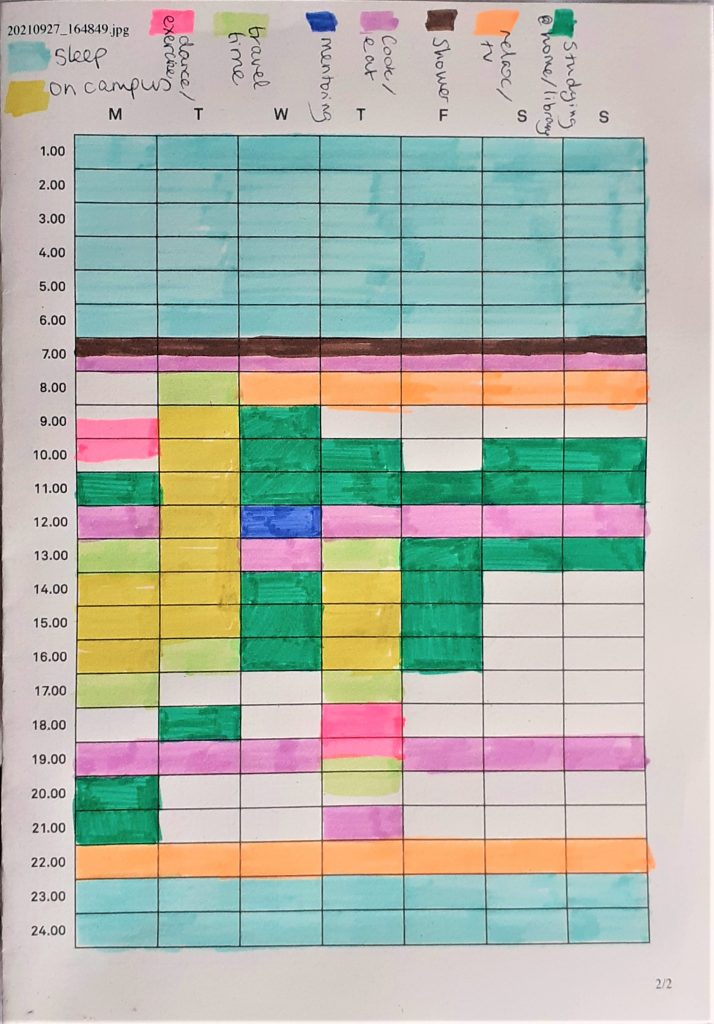
For the next task, Adam asked us to experiment with a scanned image. We coloured in timetables of our week and scanned them onto the computer:

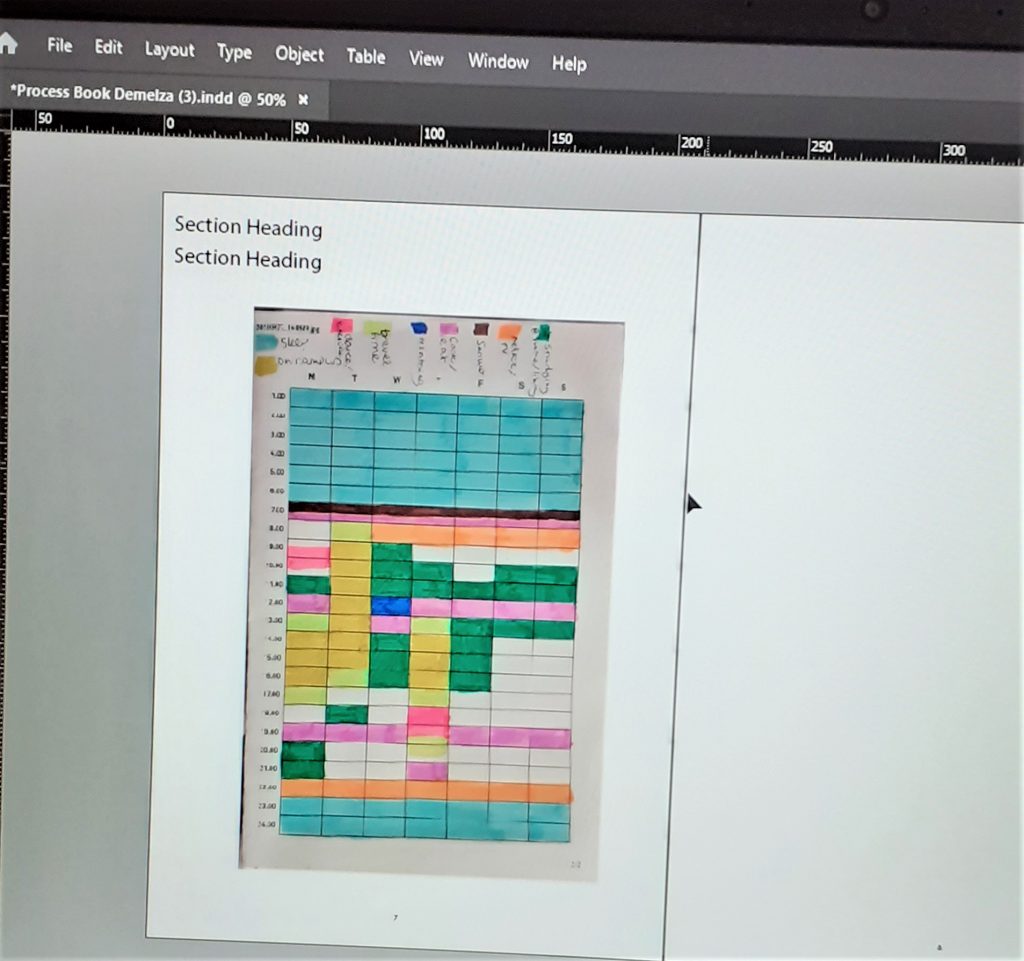
The scanner washed out the fluorescent colour from my highlight pen. Therefore, I needed to take a photo of the timetable instead.

I inserted the photo into the document by pressing Command+D (Ctrl+D on Windows) and selecting the file.

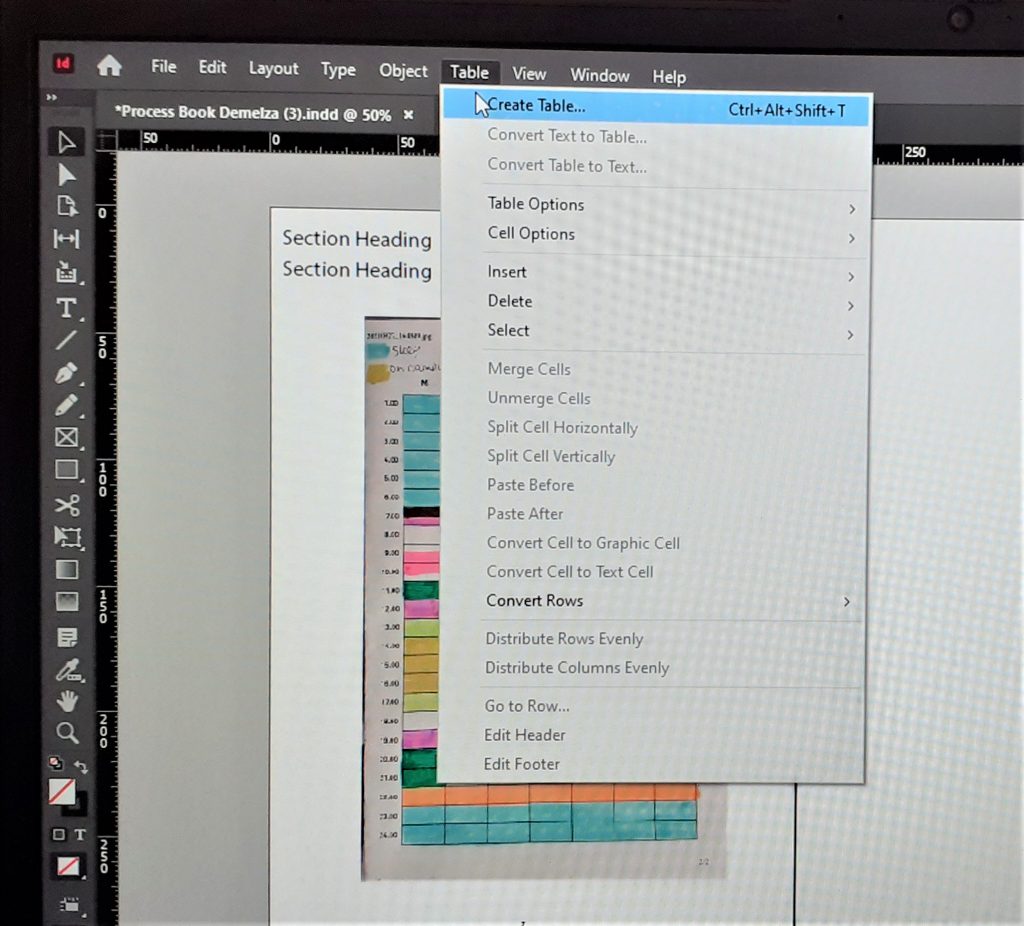
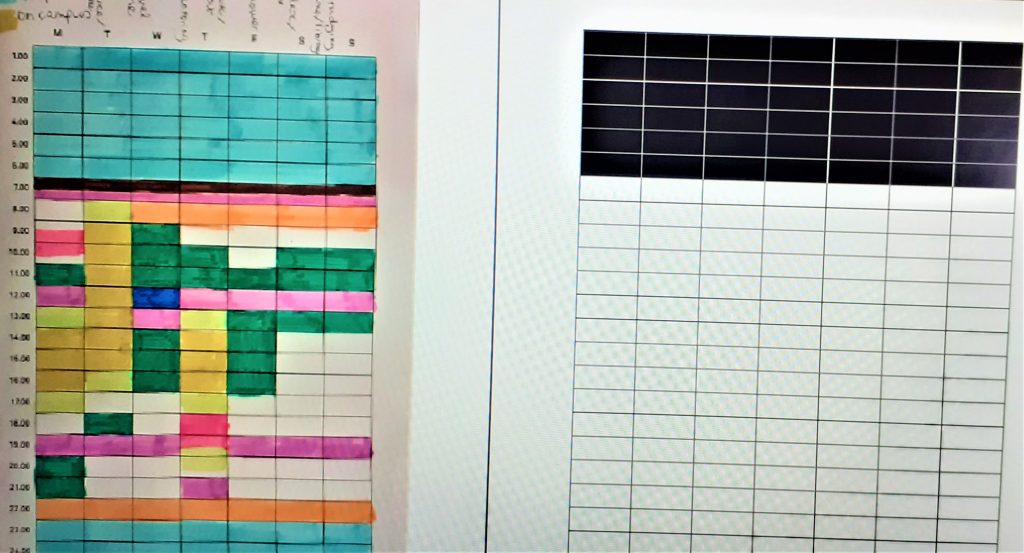
The first task was to replicate the timetable on InDesign, using the colours from the scan. I clicked ‘Table’ > ‘Create Table’.

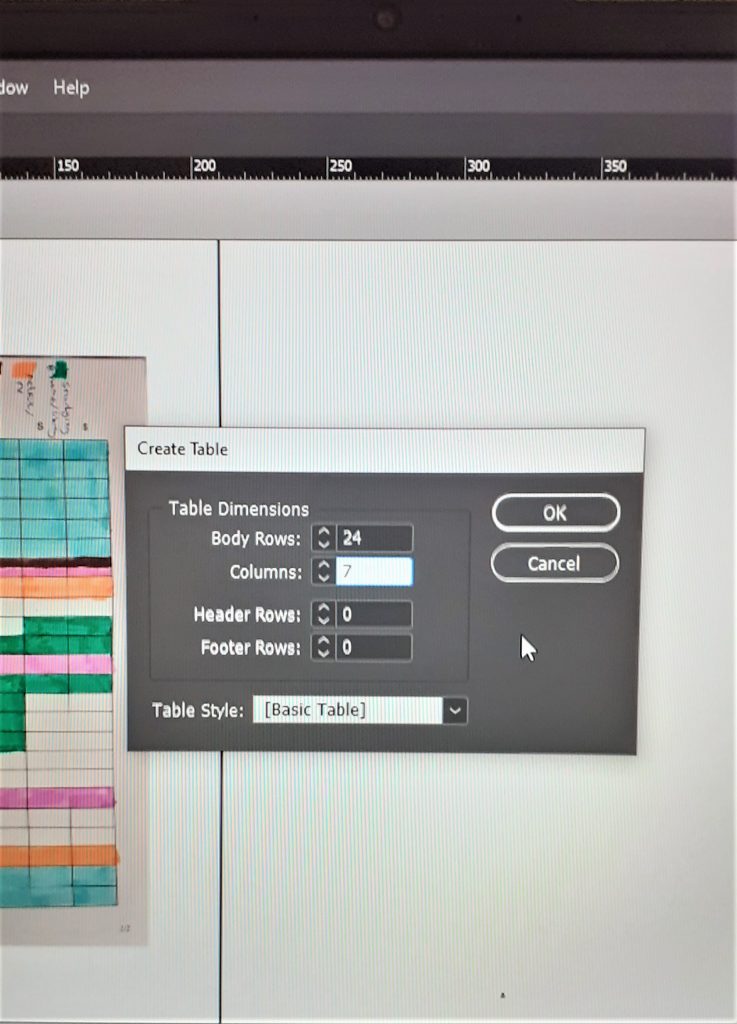
I chose 24 rows for the 24 hours of the day, and 7 columns for the days of the week. After clicking ‘OK’, I needed to click and drag the table onto the page.

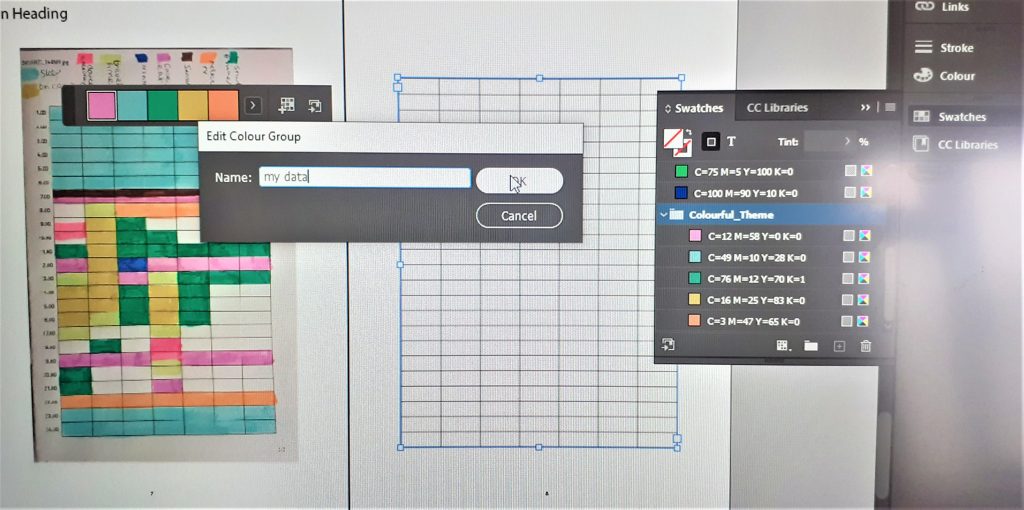
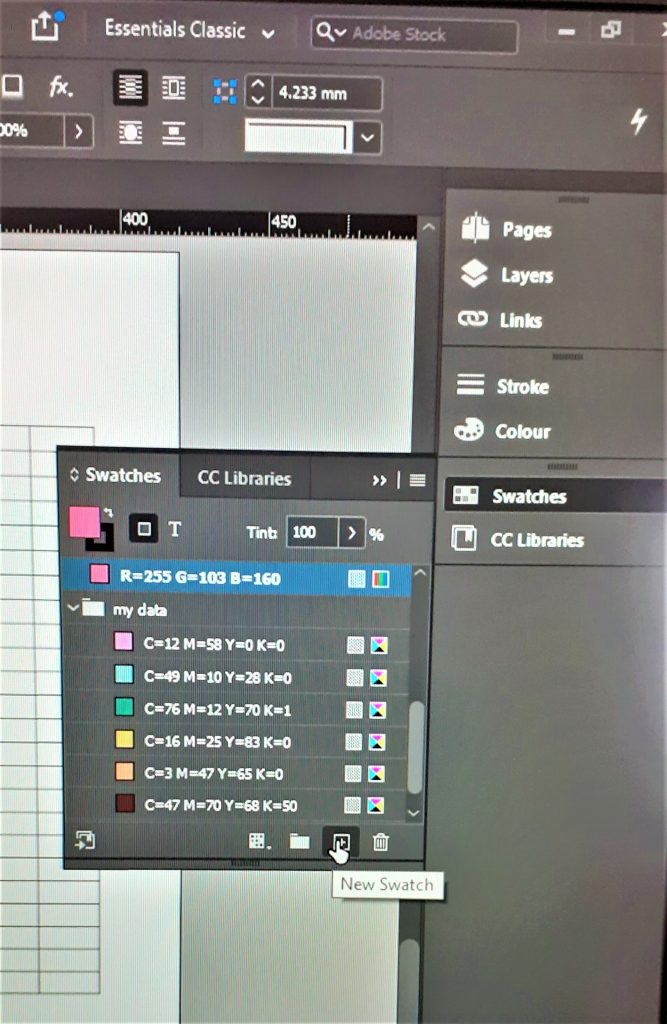
I used the colour theme tool to grab the colours from my scanned image. I added this to my swatches and named the group of colours ‘My Data’. This would allow me to find them easily.

The colour theme tool picks out a limited selection of the colours within your image. Since my image has many colours, I needed to add a few of them individually to my group of swatches.

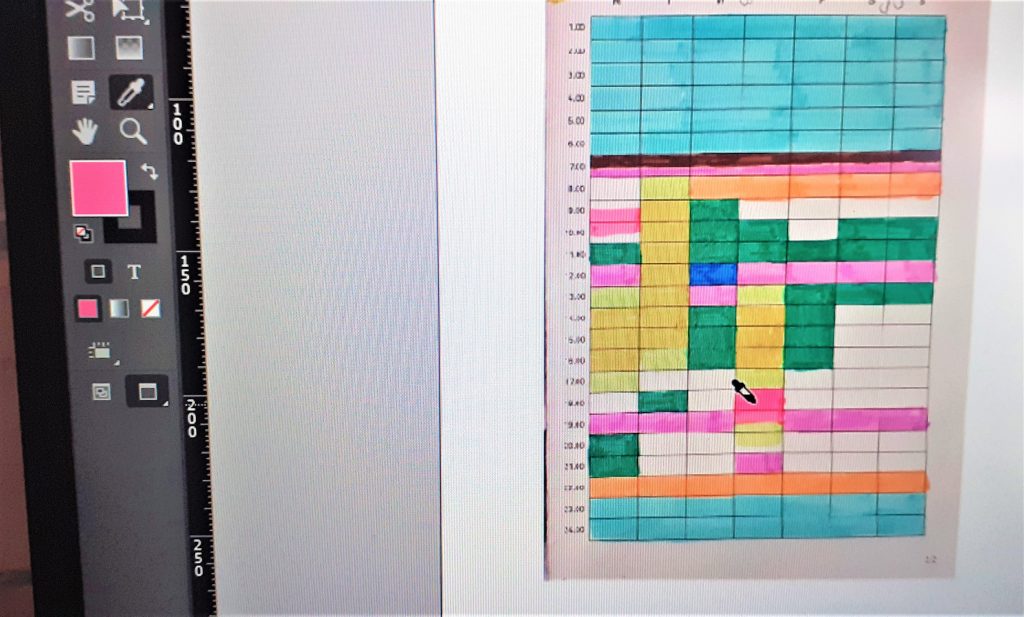
I needed to use the eyedropper tool to select the colours from my scanned image.

I added this colour to the swatches by selecting ‘New Swatch’.

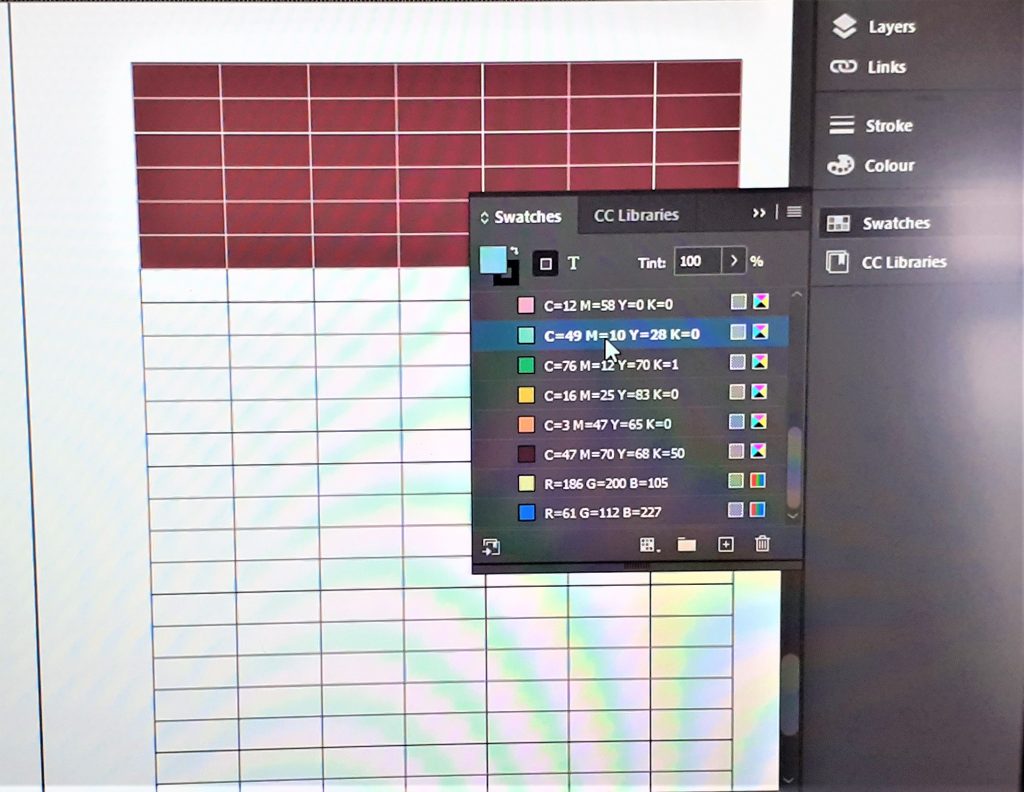
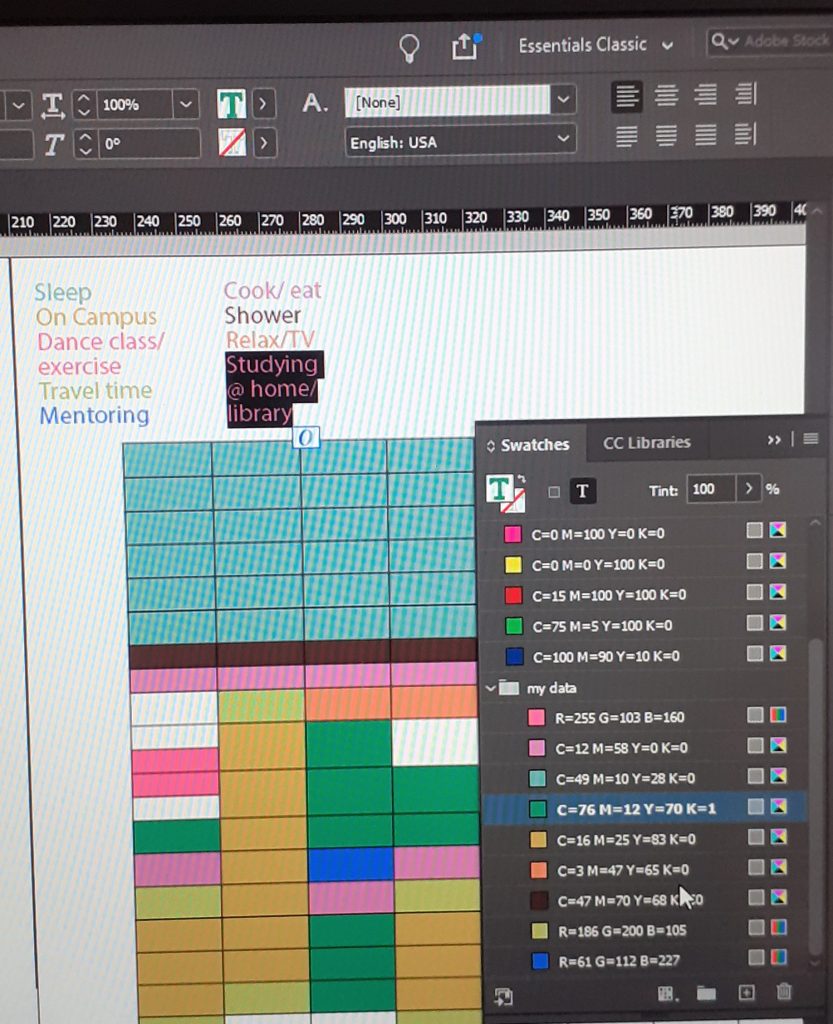
Adding colours to the table is simple! I highlighted the area I wanted to colour in by clicking and dragging. (The black area is highlighted) I then clicked on the blue colour within my data swatches:
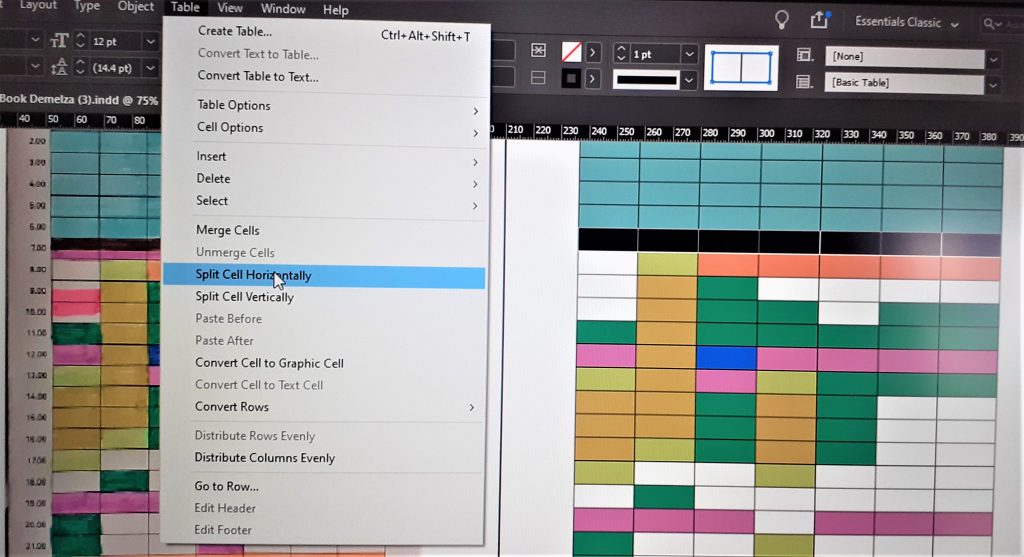
For the areas of half hours, I needed to split the cells horizontally. To do this, I highlighted the cells I wanted to split. I clicked ‘Table’ > ‘Split Cell Horizontally’.

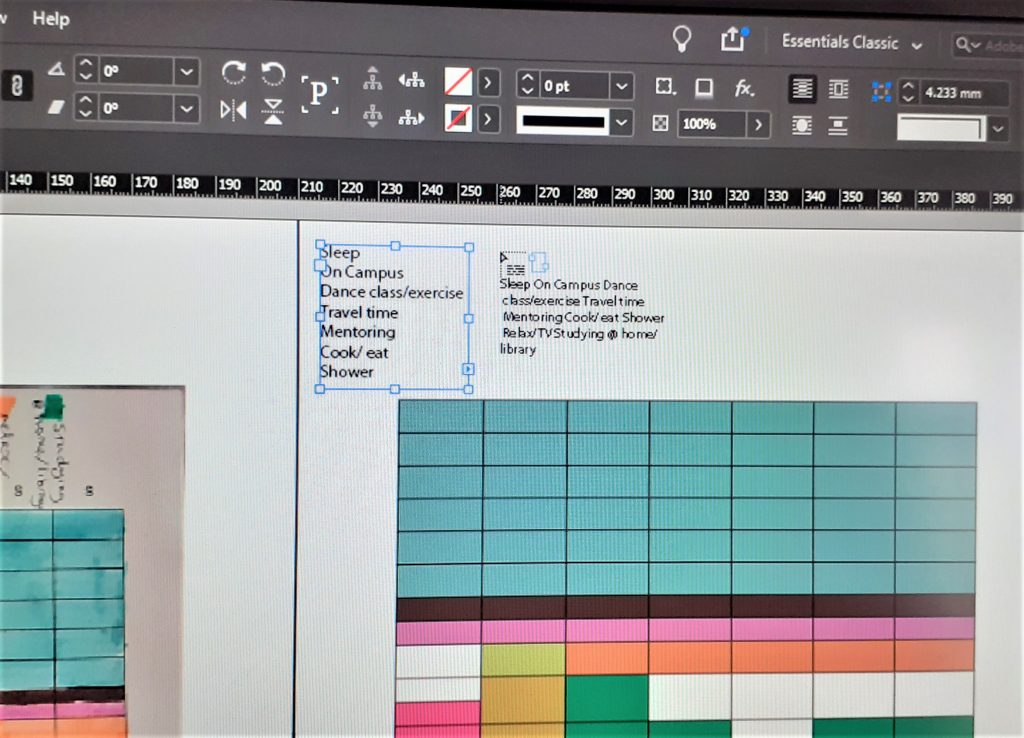
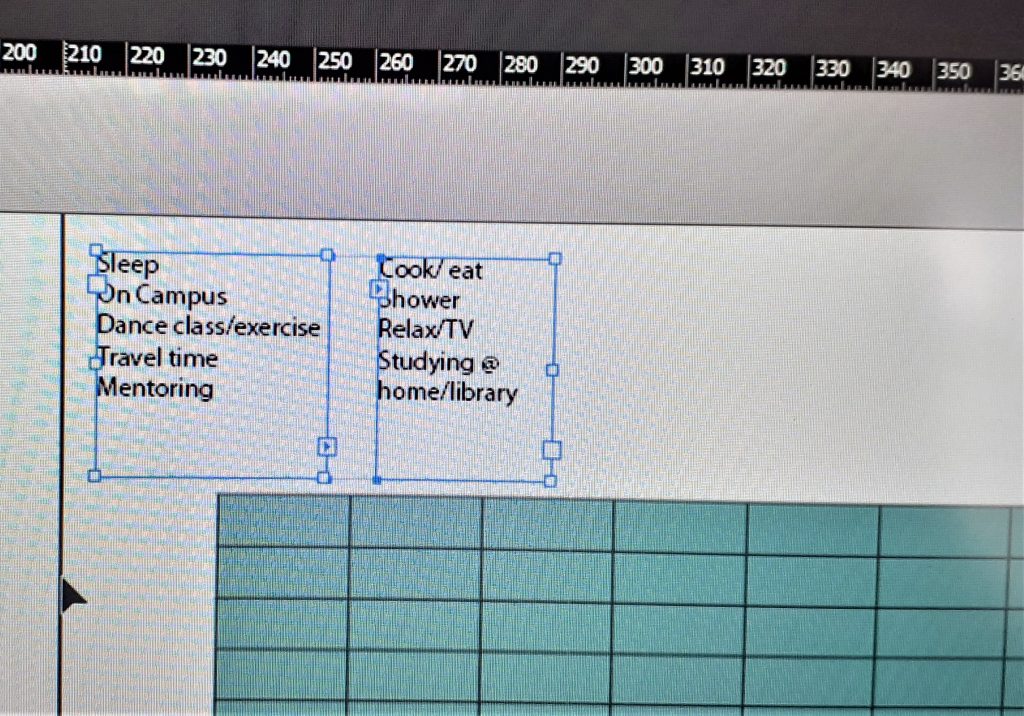
I wanted to add a key to my timetable. I typed the words in a list above the table. The list was too long for the box. This meant that a small red square appeared to tell me there is not enough space for the words. I clicked this red square and selected another area to place the words. I placed them in a box next to the first box.

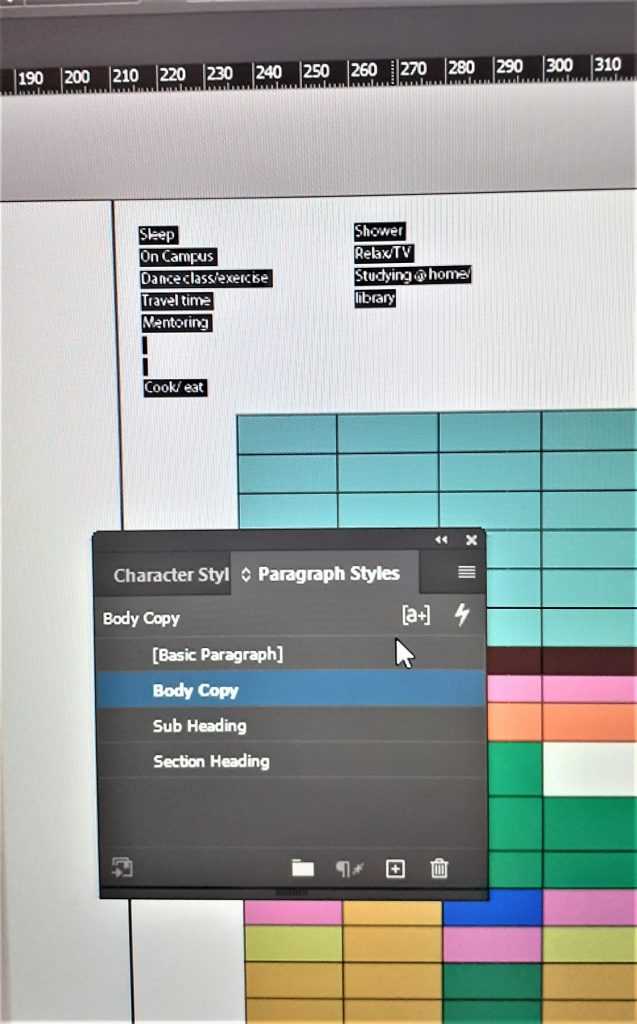
I wanted to change the font to the style I was using for the process book, ‘body copy’. To do this I needed to select the text. I clicked on the first text box, pressed down SHIFT, then clicked the second text box. This meant that both boxes were selected.

With the text highlighted, I opened the ‘Paragraph Styles’ tab and selected ‘body copy’.

I highlight each word, one at a time. I then changed the colours to match the colours they correspond to in the timetable, choosing from the ‘my data’ swatches.

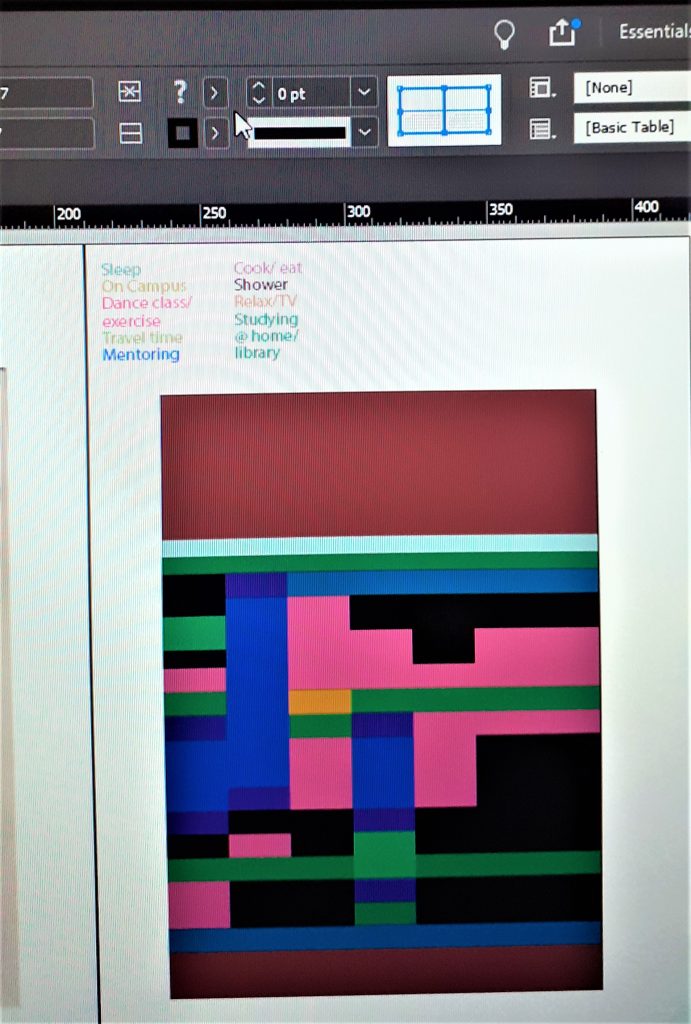
I wanted to remove the lines within the timetable. To do this, I selected the lines by making sure the lines in the square at the top of the page, were blue and changed the thickness of the lines to ‘0 pt’

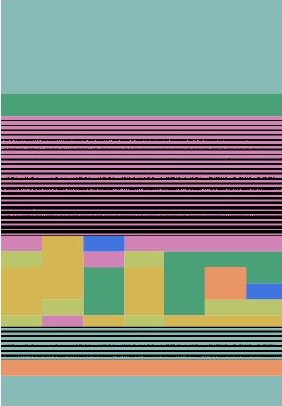
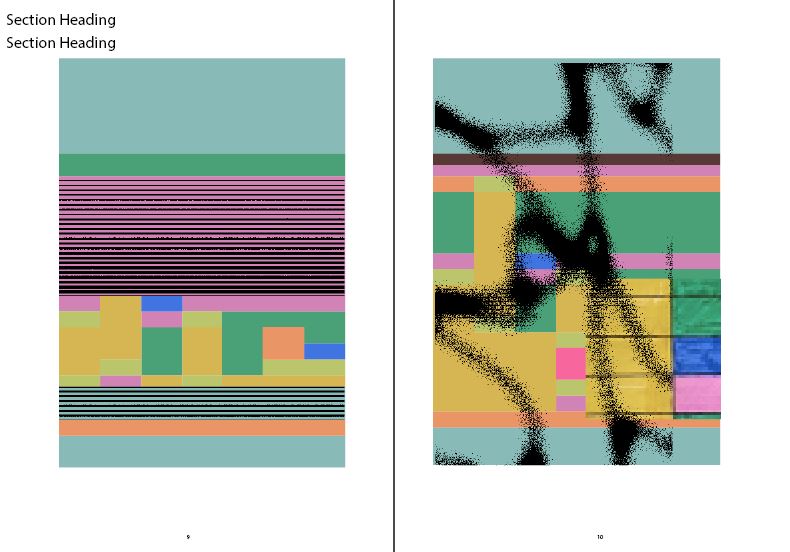
I then used the timetable design as a template for experimentation. I played with merging cells, inserting images, bitmap images and adding colour.

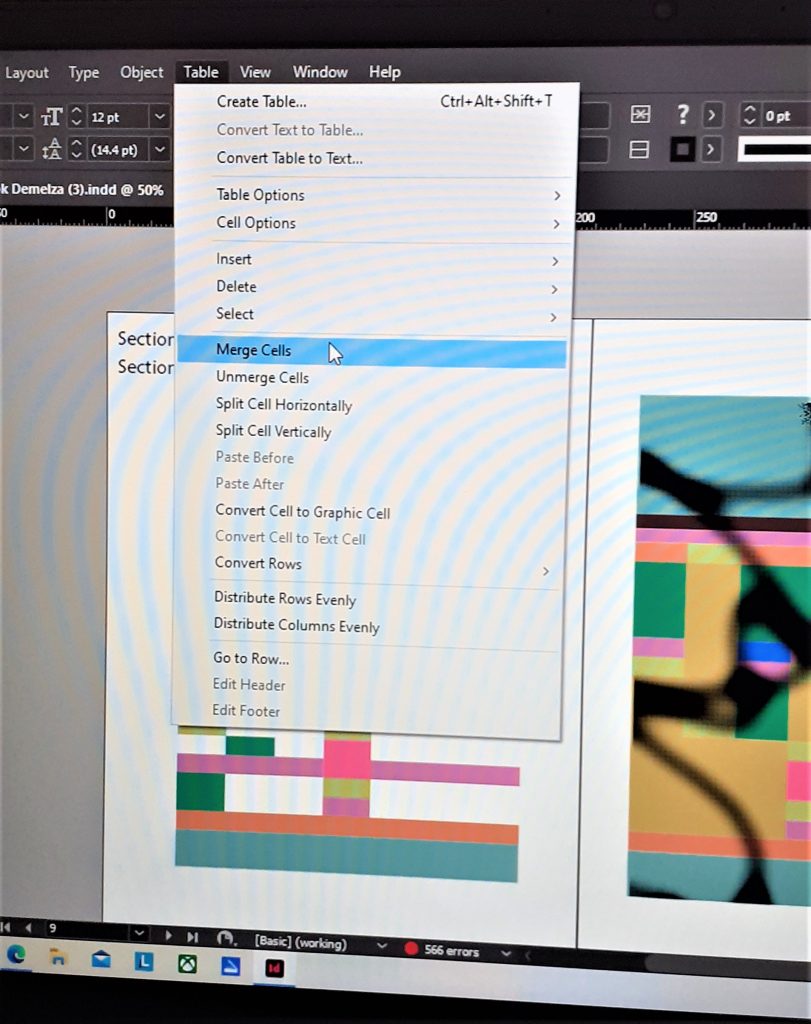
I merged cells to give me a larger area to work in. I highlighted the cells I wanted to merge and clicked ‘Table’ > ‘Merge Cells’
I used the bitmap images from week 1 and 2 to incorporate into these designs.