Visual Systems – Week 1

Year 2 – Semester 1 – Week 1

Finally, summer 2022 is over and we are back to university. To kick off year 2 on this Monday morning, Noemi has introduced us to visual systems.

During her presentation, I was reminded of the module from 1 year ago where we explored mapping. In that module I produced a map of my journey through the town. I represented this data with a series of photographs, arrows and a list of sounds, sights and smells I came across in written form. However, the two pieces didn’t work well together. Instead of being 2 halves of one map, they came across as 2 separate maps of the same data. I will be bearing this in mind when producing work for this module.

In this module, the deliverables will be a process book documenting the workshops and a set of A3 posters which explain a visual system.

In this blog, as with last year, I will be going into more depth as well as reflecting on my experience. Let’s do year 2!

An Introduction to visual systems

Today we began to think about data-capture methods. As a group we discussed visual systems as being:

  • Standardised
  • (an example being the alphabet)
  • sign system- part of a language that everyone can understand and find the meaning
  • a set of rules to guide people – this avoids wrong interpretations
  • Systems are a big part of graphic design, they communicate a set of information. They need to be comprehensive so people can understand them.
  • Efficiency. A set of rules makes the work more efficient. Using a common style makes sense because different people will be working with the grid system/ information.

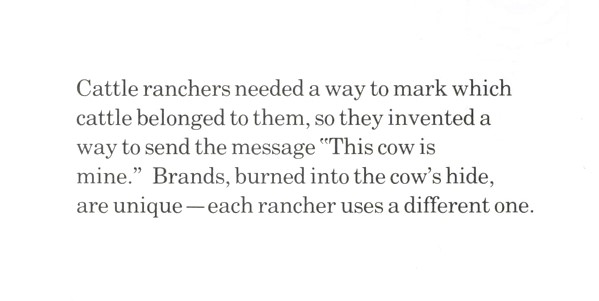
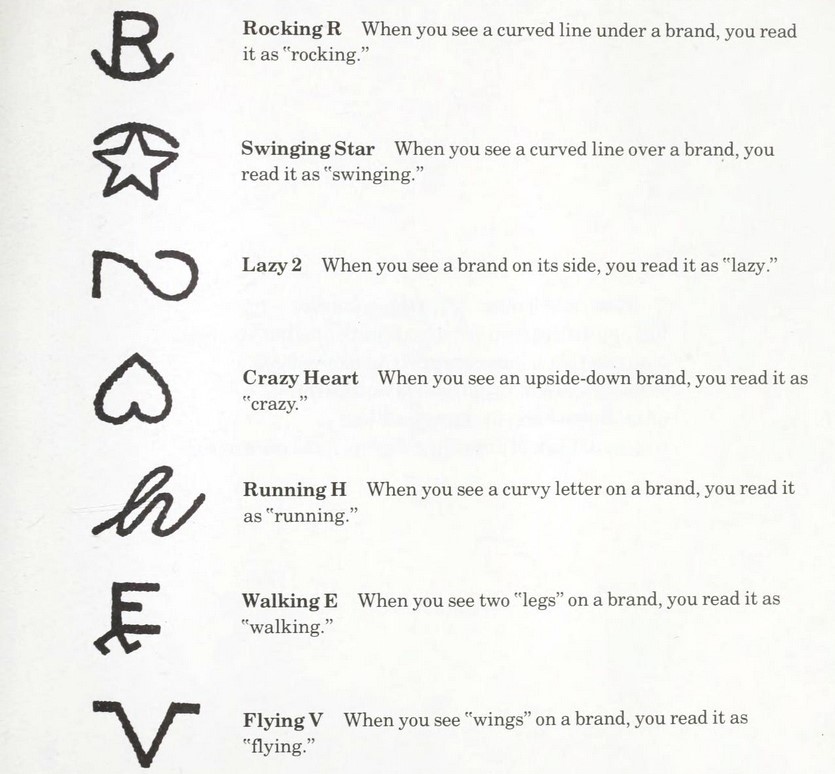
An example of this is cattle branding. Cowboys would mark their livestock (cows or horses usually) with a brand. Each owner would have his own unique marking to indicate that the animal belonged to him. An unmarked animal would appear to belong to nobody. (Fun fact: Mavericks were people who refused to brand their animals).
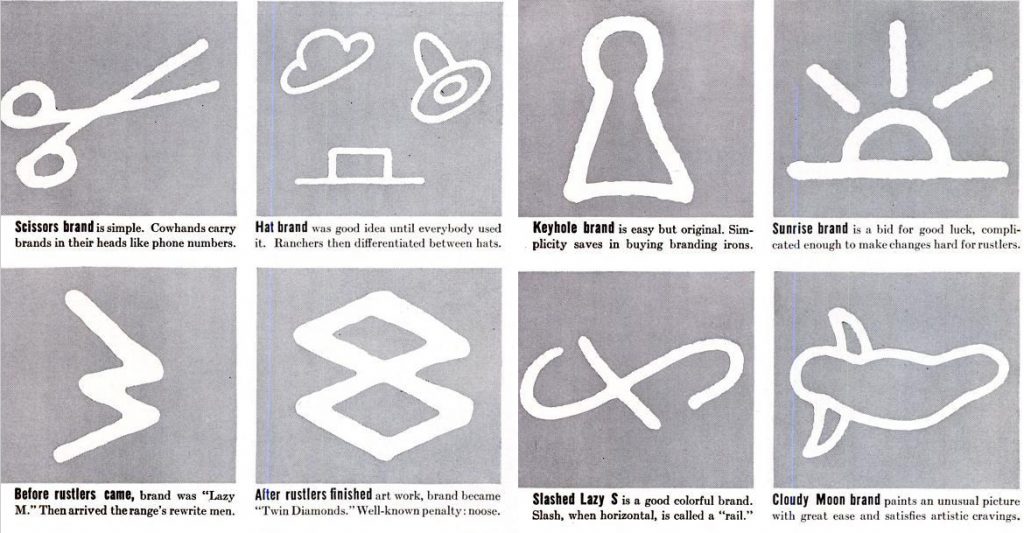
“As with consumer brands, cattle brands must be simple enough to be recognized, but complex enough not to be changed – a P into a B for example, which was very common. Counterfeiting and theft are still happening and farmers need to increase their efforts to brand their cattle.” “Drawing a parallel today, wearing brands on our clothes or on everyday objects, we may wonder if we have not become the herd of modern cowboys

https://www.grapheine.com/en/graphic-design-en/hot-iron-cattle-branding-brand-on-the-skin
Typographic grid

A typographic grid is something I have explored in Project #4 of the summer project. This is a system because each different letter is created using the same grid. (see below example)
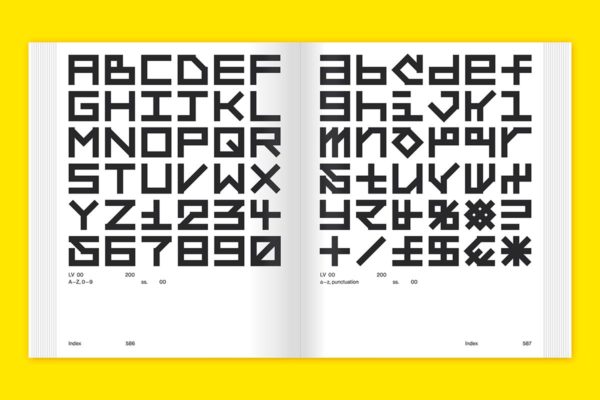
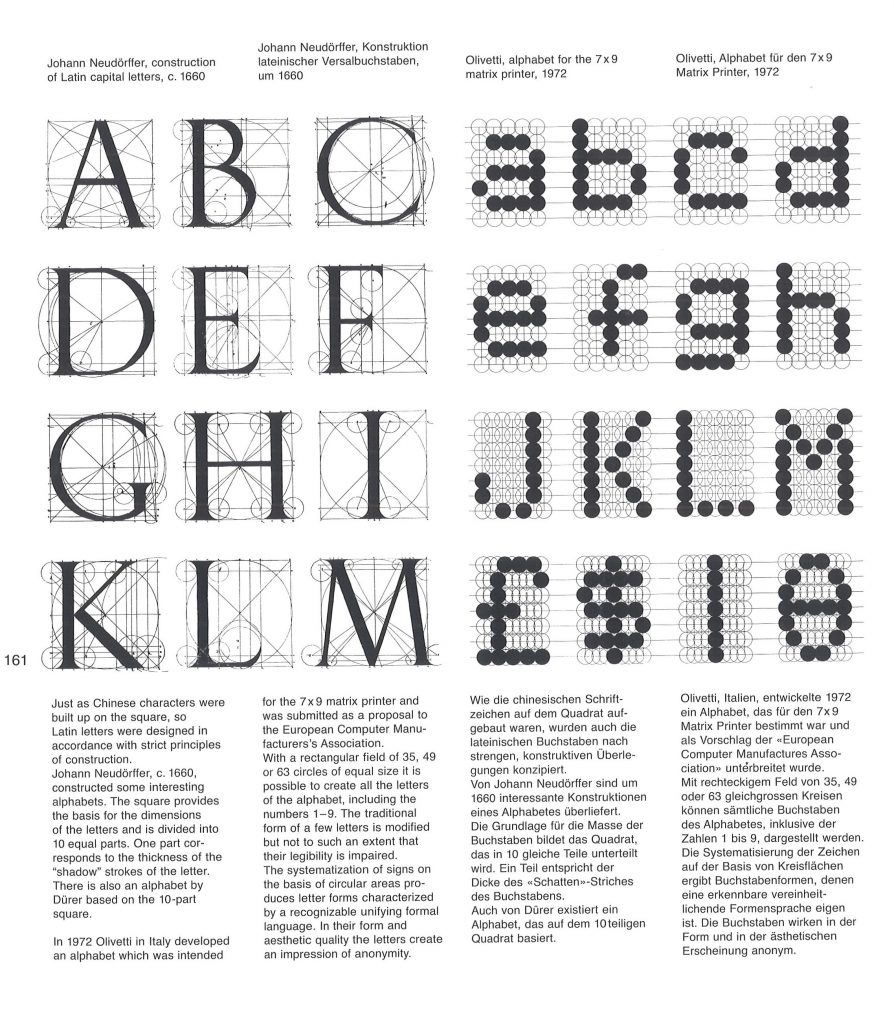
Nigel Cottier- Letterform Variations

A system helps you manage a collection of information and unifies the different components. This makes it easier when needing to communicate information to an audience.

2000 en France

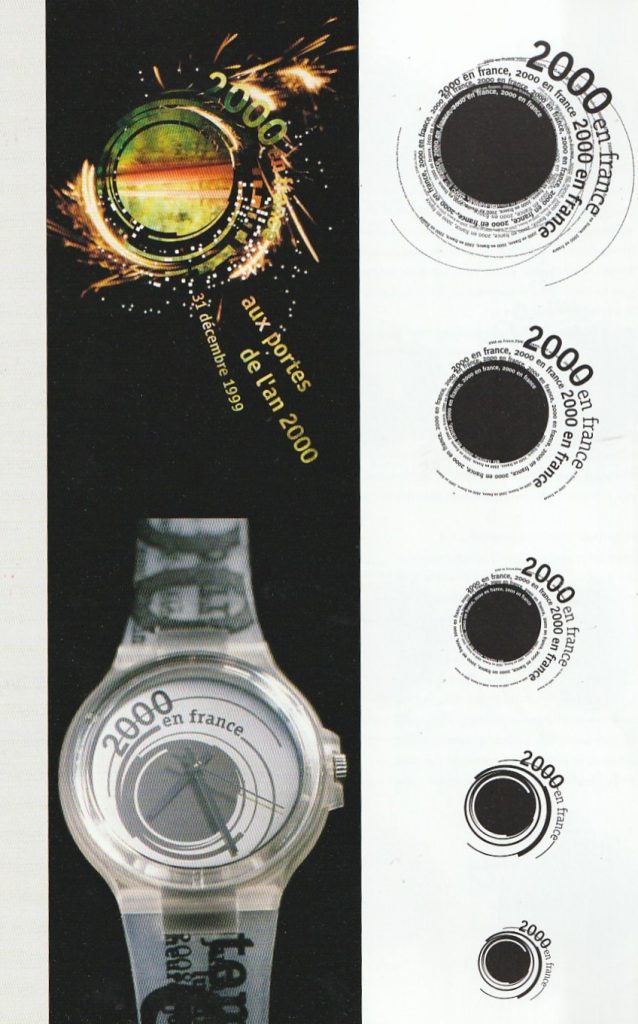
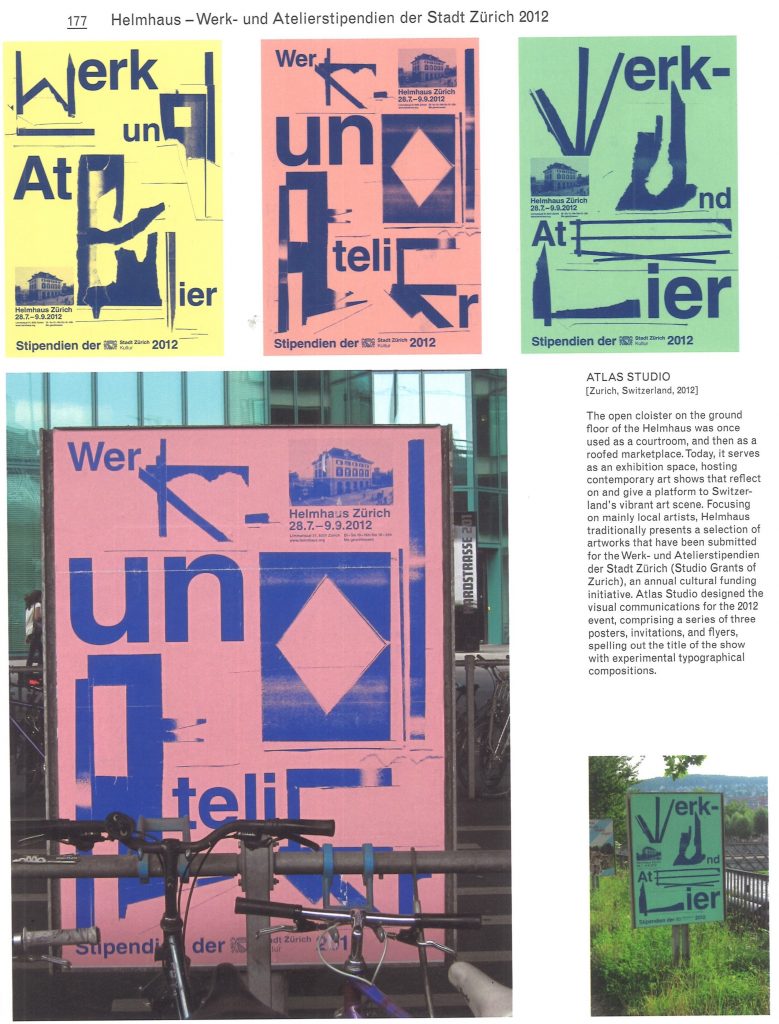
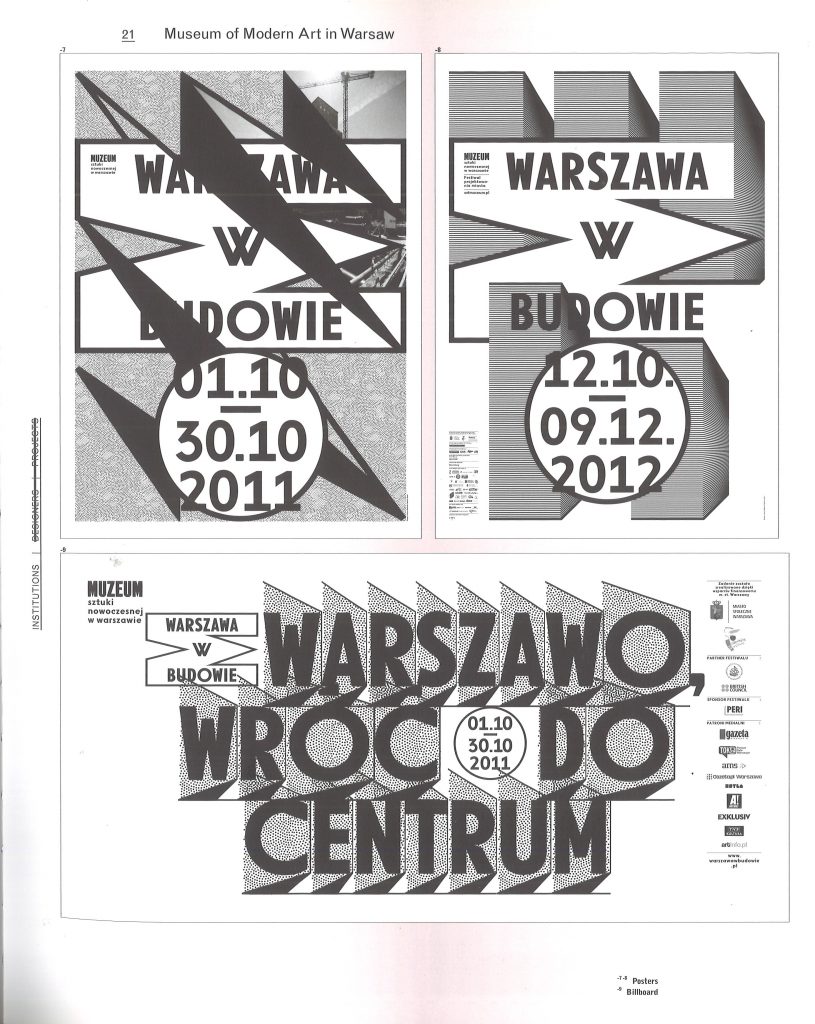
For the millenial celebrations, a programme of events titled ‘2000 en France’ was organised. A visual identity was designed for the programme by Integral Ruedi Baur et associes.

This visual system is based around a swirling shape surrounding a circular image at the centre. The designers were able to keep this structure and font the same, whilst changing details such as colour, image and the words themselves. This allows flexibility. Flexibility means lots of layouts can be created from the same elements.

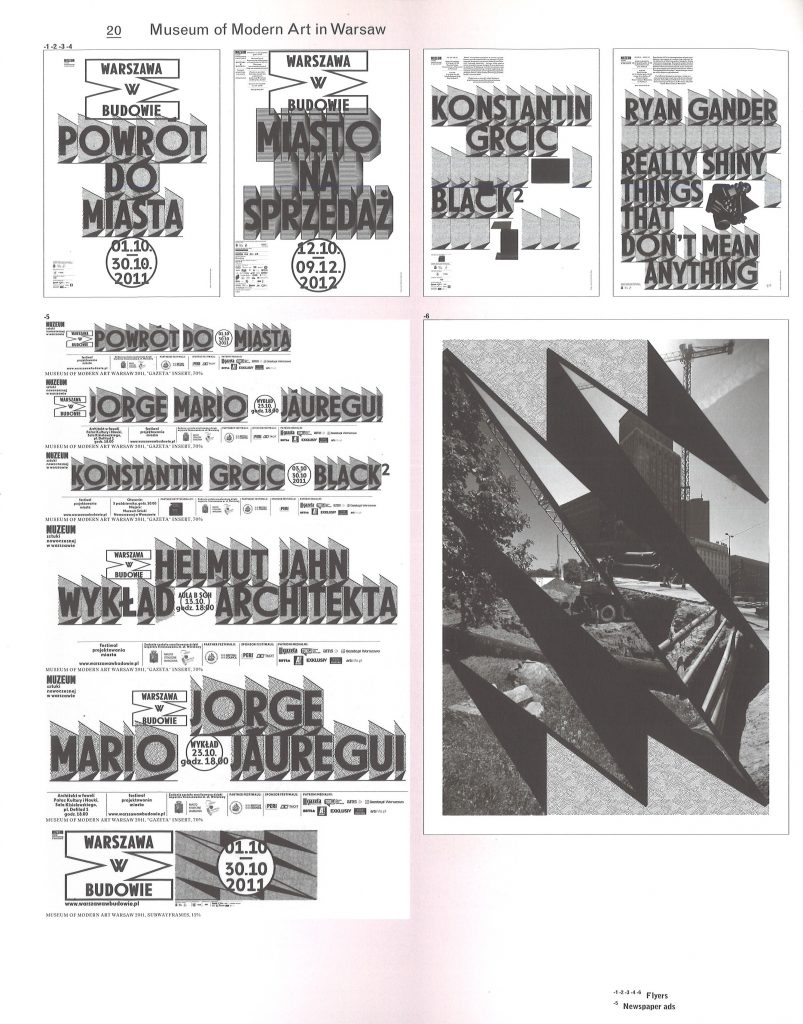
There needs to be common elements across the system to keep consistency.
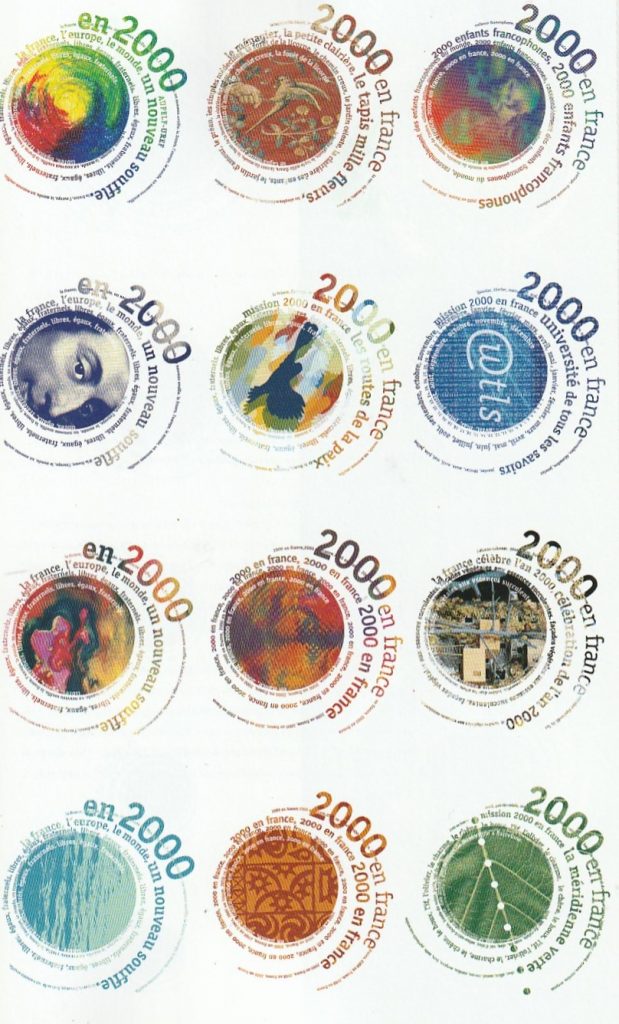
Visual identity for 2000 en France, the design allows flexibility by keeping some elements the same.
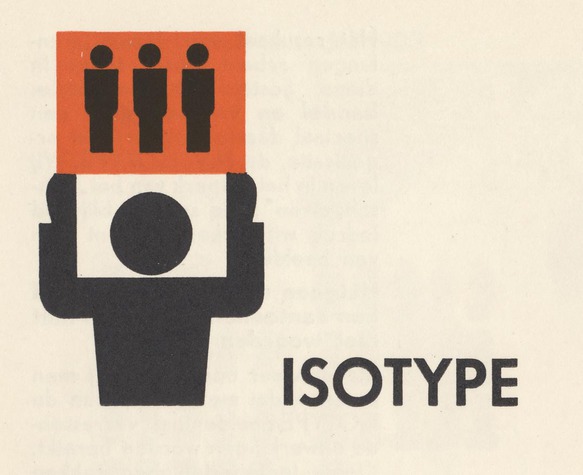
Isotype system

I have spoken about the Isotype system in my previous post here.(insert left to right post)

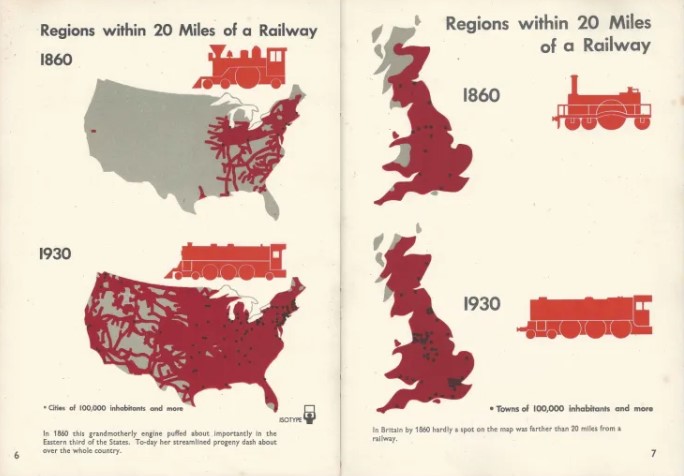
This system functions like a language/ an alphabet that everyone can understand. Just by looking at an Isotype image, they can see the data through the pictograms. This is what makes it effective, as it can function across language barriers and levels of cognitive ability.
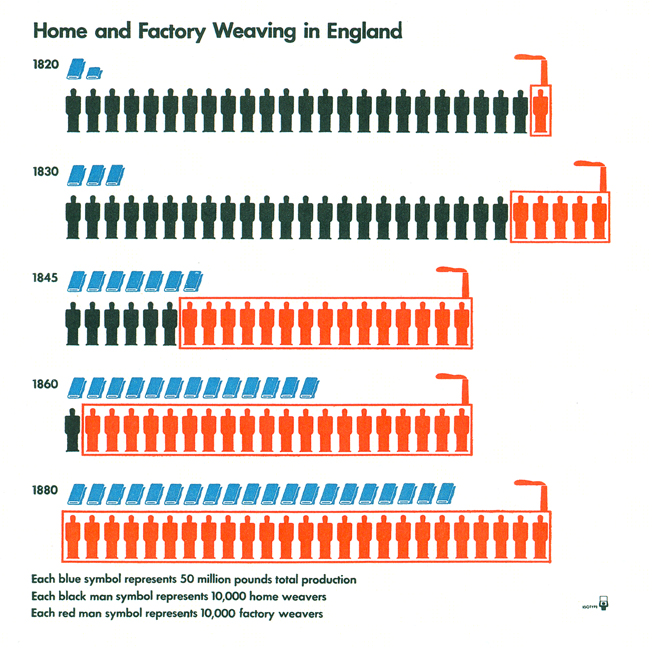
https://eagereyes.org/techniques/isotype

Visual systems require people to share them and they need to be able to be accessible so everyone can understand them, otherwise misunderstandings happen.

Transport systems

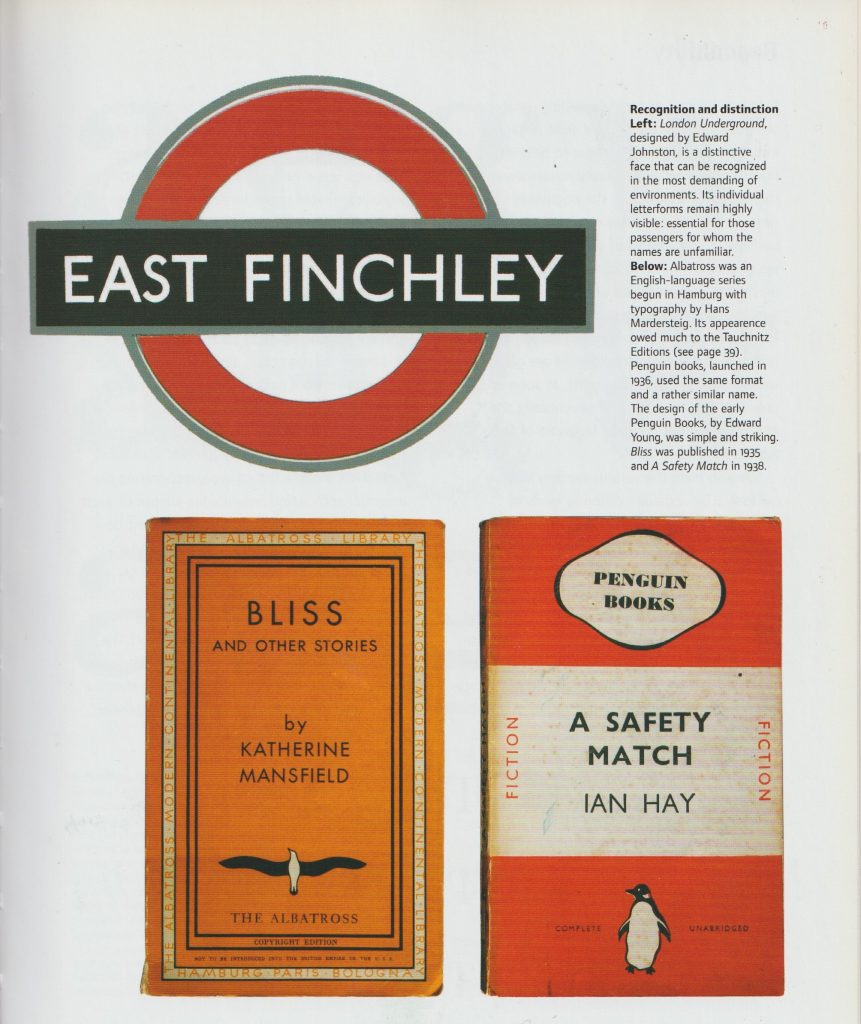
Visual systems help to navigate complicated or chaotic information, for example transport systems, which can be hard to understand because of the number of routes and destinations in a sometimes small area. The London Underground map as we know it today was designed in 1931 by Henry Beck. Geographically it is less precise than previous versions, but it is more effective as a visual system because it is laid out like an electrical system, with right-angles. The stations are not the correct distance apart, they are spaced further in order to be easier to read. This design solves a problem.
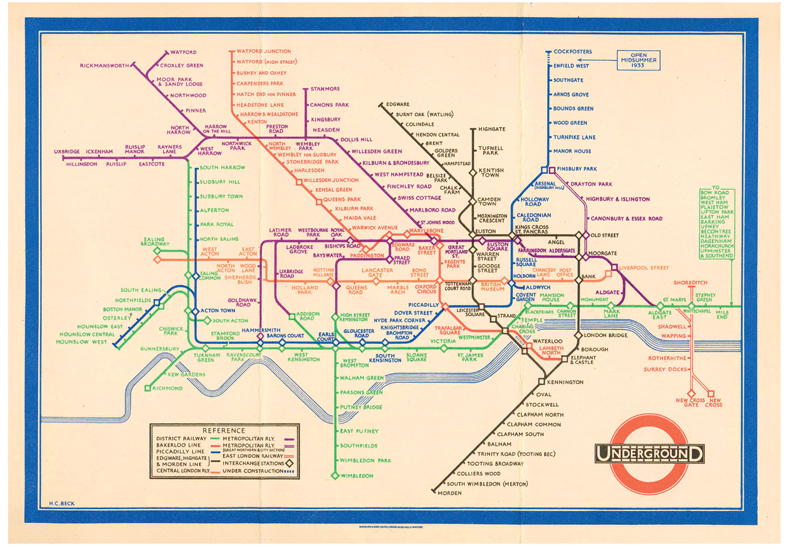
1933 pocket map of the London Underground

The new map was colour coded and used verticle and horizontal lines. The use of spacing made the map clearer.

As a designer, your job when applying a system is to decide whether to be selective with the information and possibly simplify things. We need to consider our responsibility– the system is to be used by many different people to help them get to where they need to be, for example.

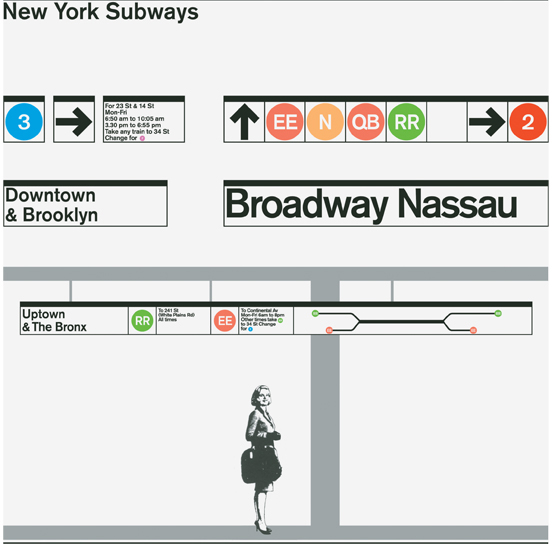
A visual system can allow durability– it can last many years- optimising a few elements, for example the New York subway system hasn’t changed much from 1960’s – now. Massimo Vignelli and Bob Noorda took inspiration from the London Underground system when they designed the New York subway map.

Before it had been chaotic to navigate the subway. When setting up the graphic language, Vignelli and Noorda spent time analysing the underground system. This analysis informed the design.
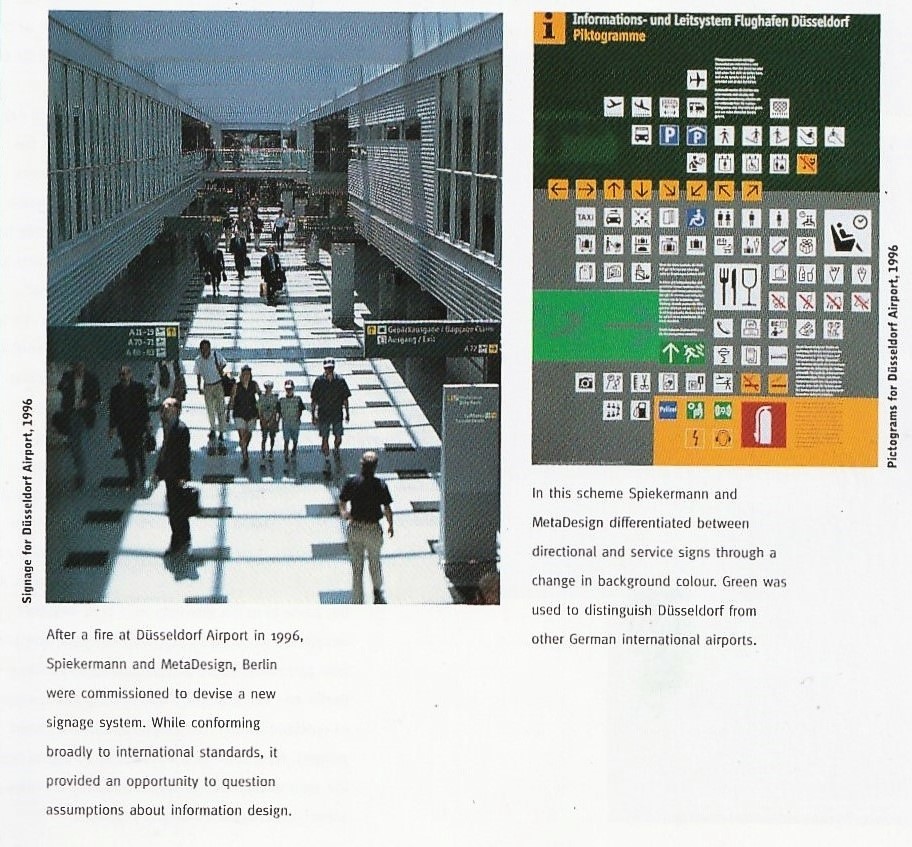
From A Century of Graphic Design by Jeremy Aynsley

The UK transport sign system was designed by Jock Kinneir and Margaret Calvert in the 1960’s.(Some examples of which are displayed at the Design Museum in London.)

Before this system, there was no standardised style, it was messy and confusing for road users. Many colours and proportions were used but now the sign system is still in use because of its effectiveness.

When Kinneir and Calvert were coming up with this system, they devised a new font specifically for use on road signs. They tested this font extensively to ensure it could be read from afar.
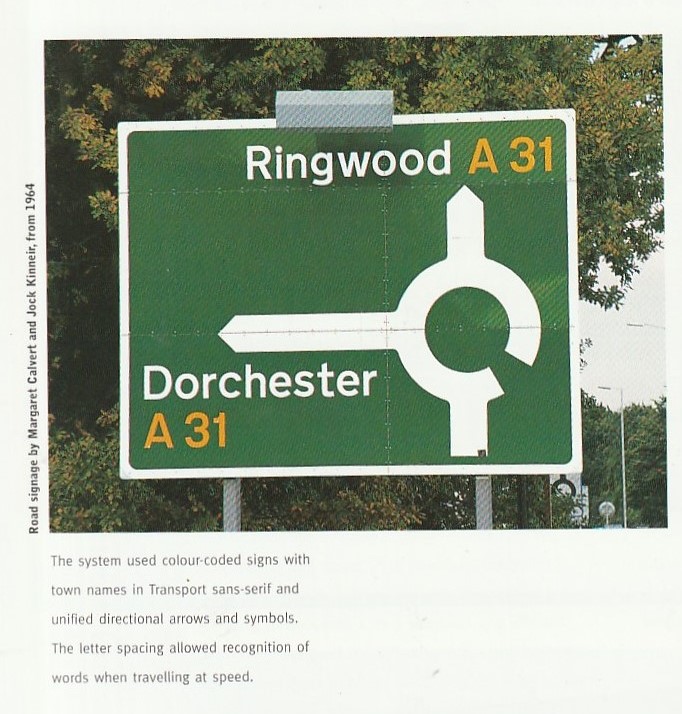
From A Century of Graphic Design by Jeremy Aynsley
Modernism

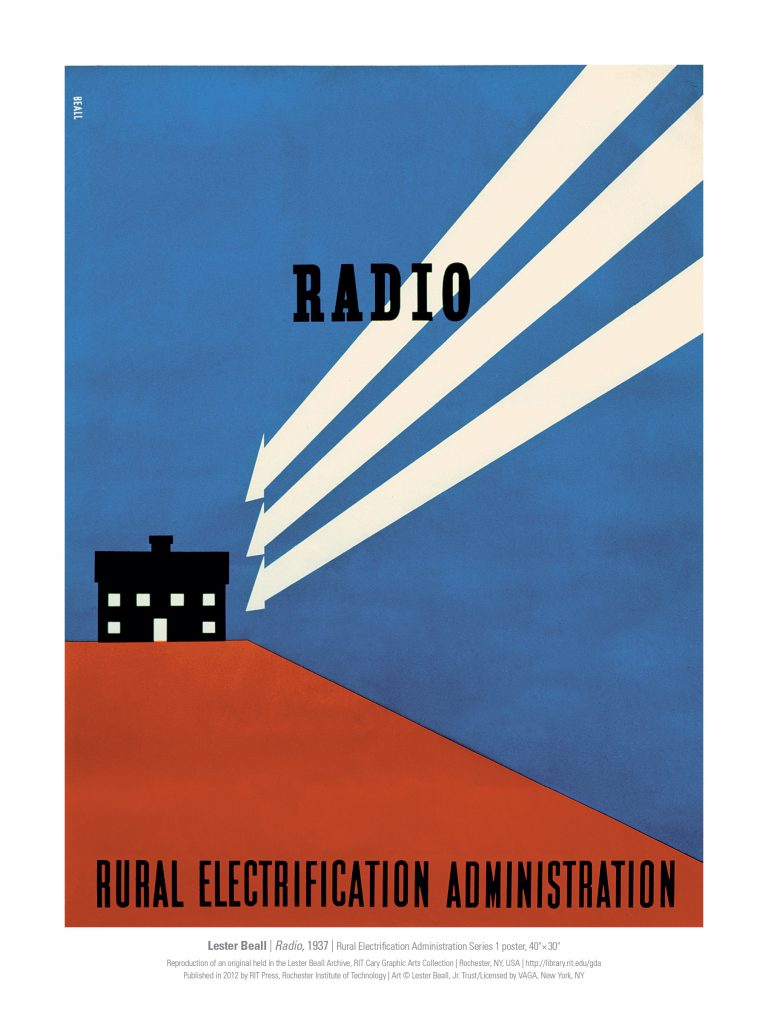
Lester Beall Rural Electrification Administration poster

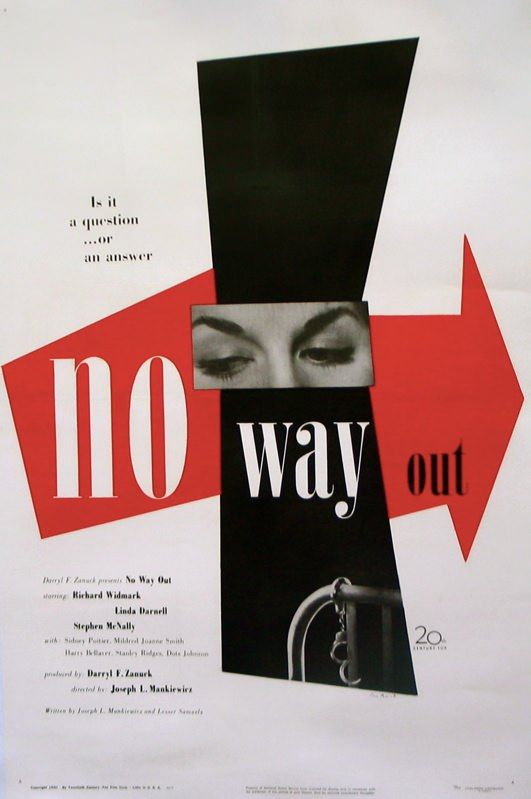
Paul Rand film poster

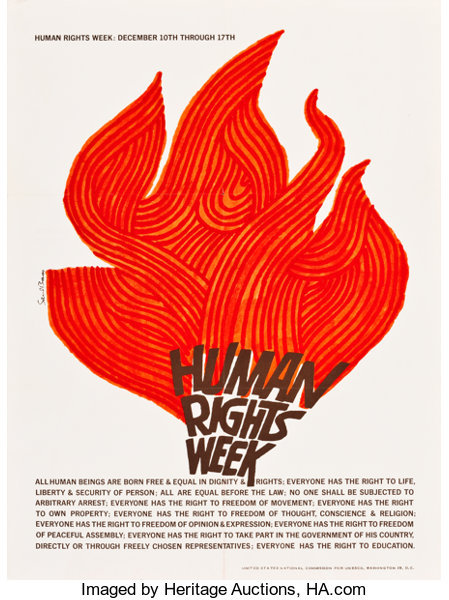
Human Rights Week by Saul Bass (UNESCO, 1965). Poster

The Modernist style came about after the 2nd world war. Visual work such as poster designs from this era optimised the grid. They were easy to digest because the eye is directed around the page to the important information. The posters contained simplified graphic elements which are visually appealing and fun, in my opinion. The designers used minimal colours.

Post-modernism

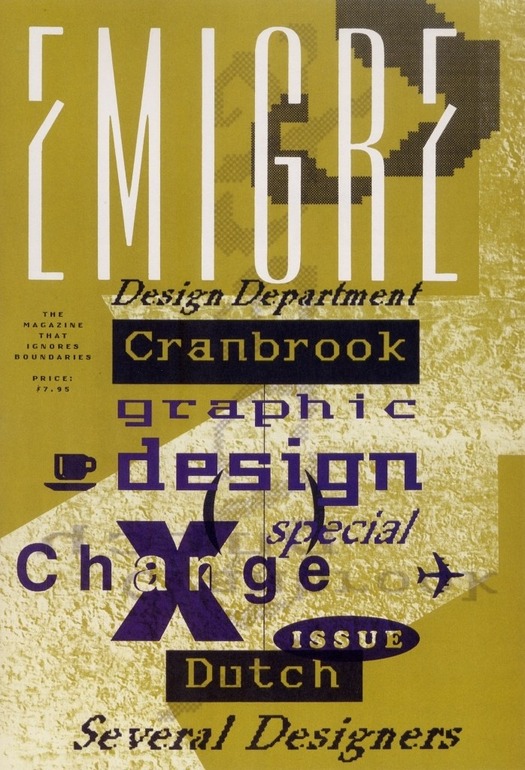
When entering the Postmodern age, designers felt that the grid was constraining and they rejected the ordered layout of Modernism. Instead, their work expressed freedom and joy. One example is David Carson-
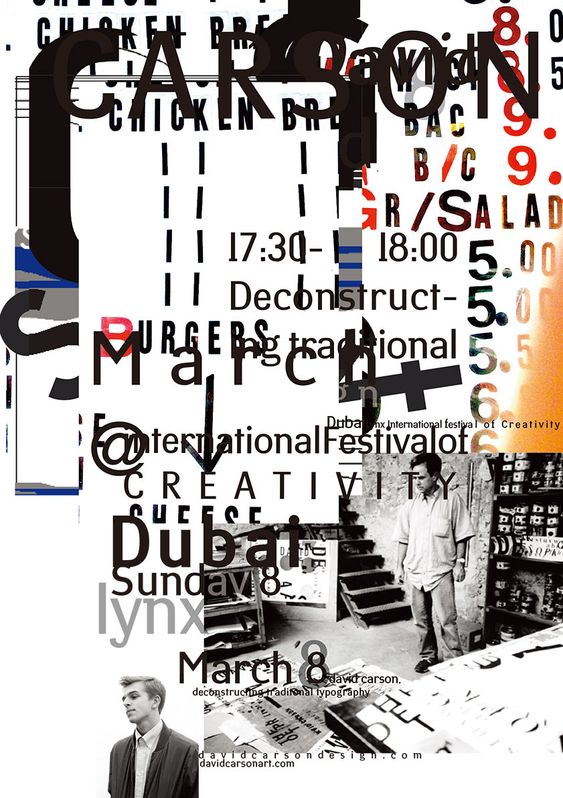
David Carson’s work is its own system because it’s in his own style of graphic design. You can see it is his work because the same elements are featured, for example layering, rough edges, repetition and the rejection of the grid.

Designers then began to move away from Postmodern approach, around 1995. They felt the style was too chaotic and lacked control.

We can see a kind of circular movement in graphic design, where designers went backwards to take some inspiration from the designs that started graphic design in the first place- the Modernists.

Andrew Blavelt is a designer, educator and writer. In this time period, he began to ask the question, is there a way forward? It became apparent that systems are applied to give control and that there was a necessity to apply rules. Modernist posters are similar to sign systems this way, since they follow certain rules.

To summarise, we came up with a list of variables that are important to consider when designing a visual system:
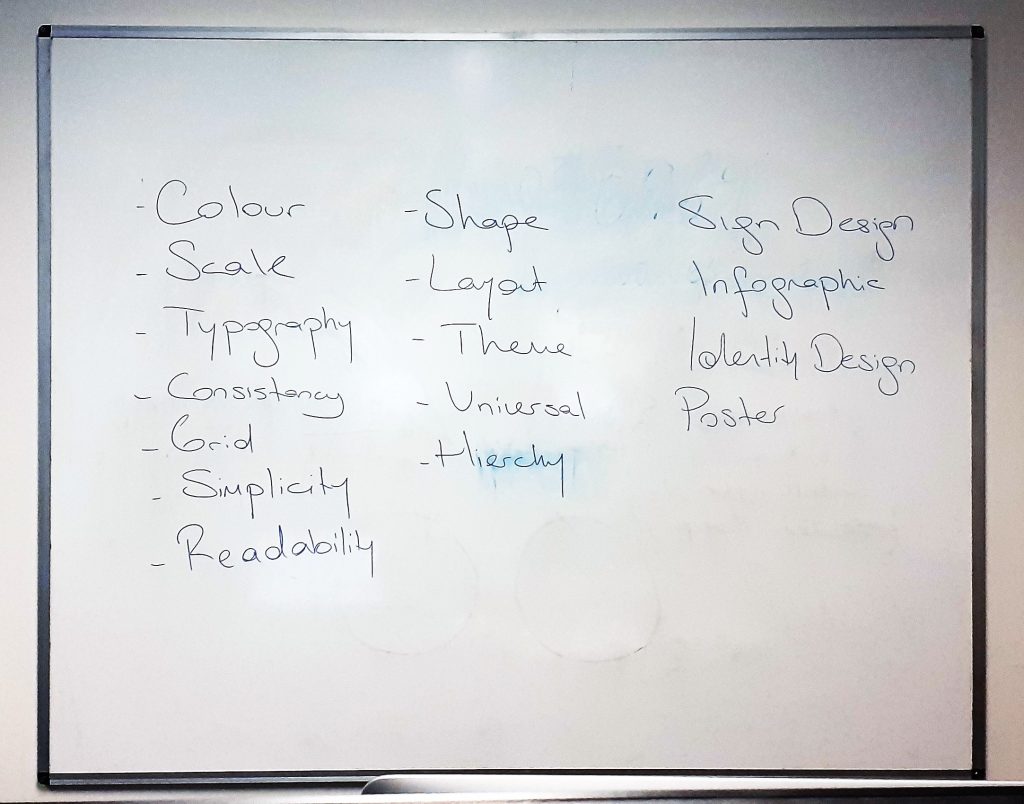
Workshop: Data Visual vocabulary

The group took part in a workshop focused on 8 emotions. The purpose of this workshop was to get used to the idea of visually representing something that doesn’t exist physically. We used pencils/pen on paper. This was the perfect exercise to kick off the new semester and get us thinking creatively.

For the 1st sheet, the focus was on shape. I needed to think about how I could optimise the same shape in 8 different ways to express the emotions. In some ways, the restrictions made this exercise easier. I found it more challenging to consider colour as well as texture and shape all at the same time.
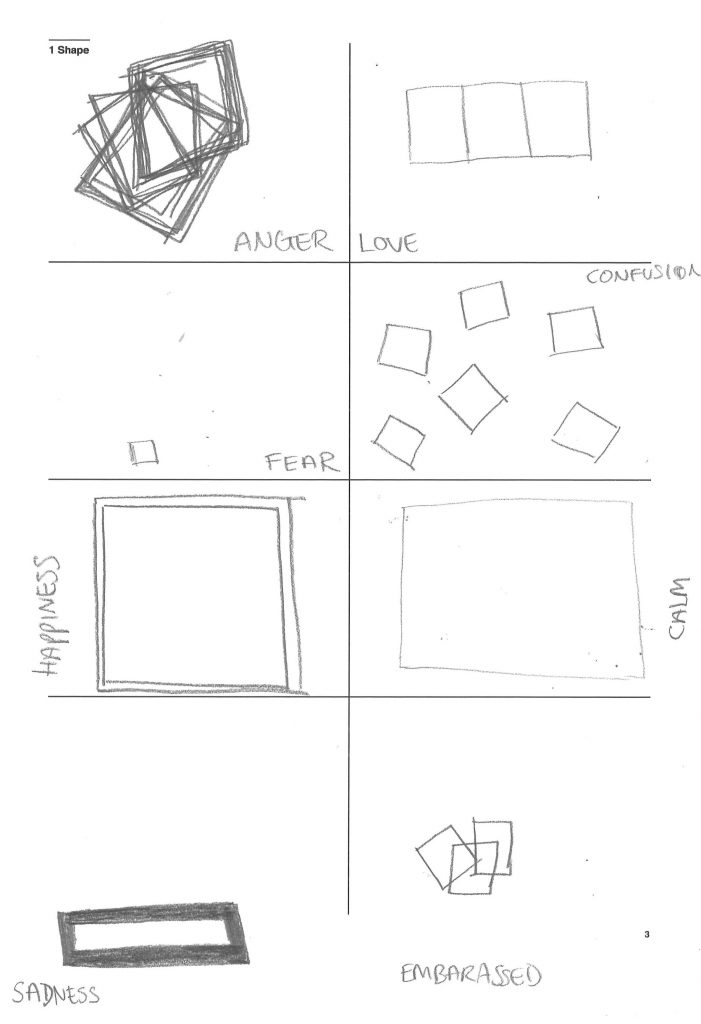
Using a square, I aimed to express the 8 emotions.

Anger – repeated squares expressing the way your thoughts race when you feel anger. Many thoughts layering up.

Fear – A small square that has sunk to the bottom of the page in an attempt to hide.

Happiness – Bigger and bolder, taking up space, drawn with a confident line.

Sadness – The sad square has also sunk to the bottom, but unlike fear, it is heavy and therefore has a thicker line.

Love – Love is a feeling of connection to other people, in my opinion. Therefore I drew 3 square in a row, they’re on the same level and they’re connected.

Confusion – Confusion is several floating squares that have no direction. They’re moving and lost.

Calm – Calm is an openness and also light which is why I used a lighter line.

Embarrassed – I repeated 3 squares to represent the shifting and stumbling around of a person who is embarrassed and doesn’t know where to look or what to say.
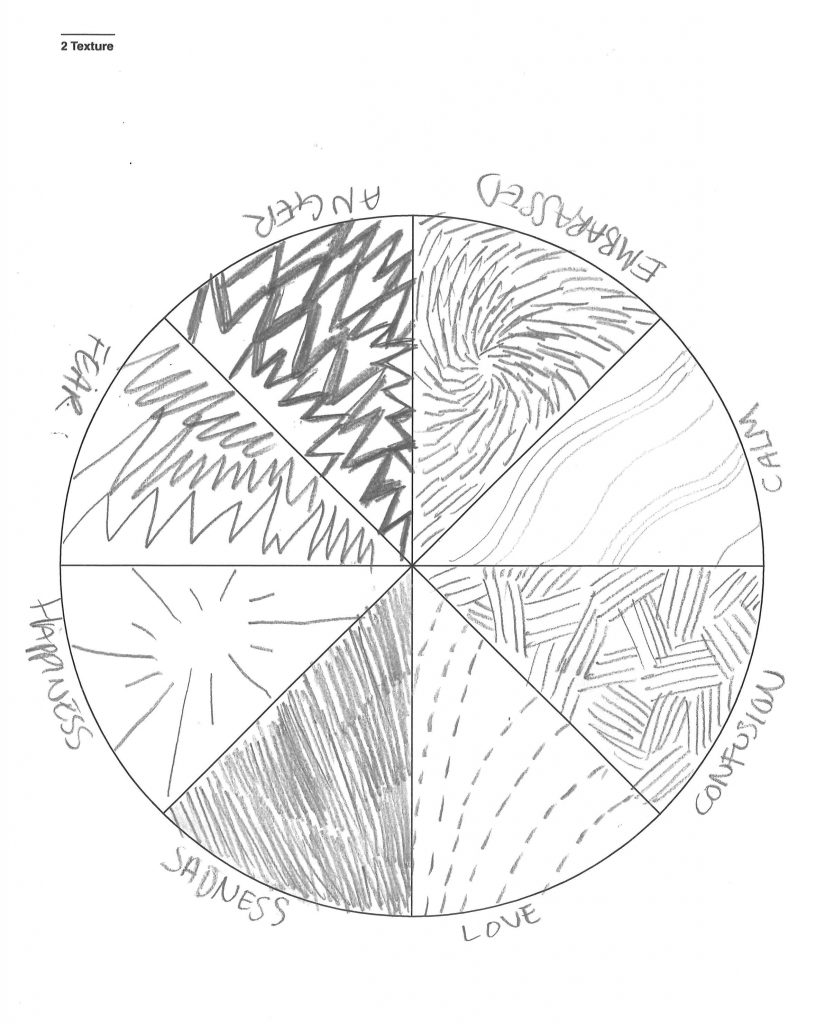
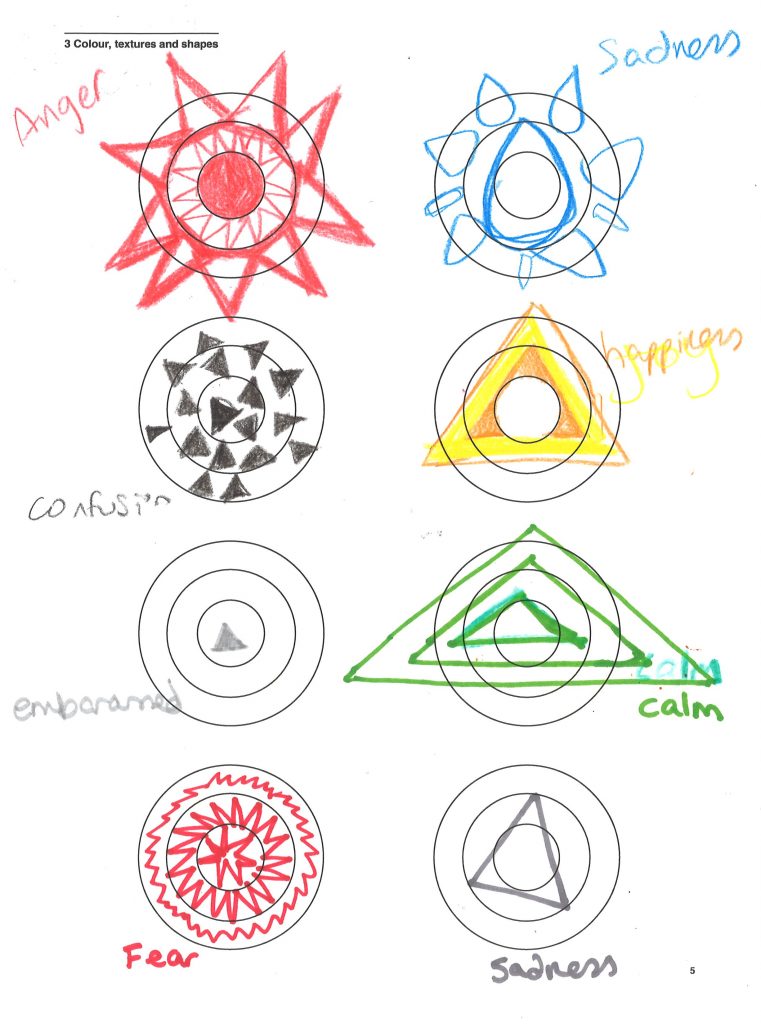
The 2nd exercise focused on texture and how different textures could express different emotions. I used line to express the emotions and varied how the line was used. A thicker and zig zagged line expresses anger because of the boldness anger brings you. The curved and soft line represents a calm breeze perhaps.
  • I chose to use the triangle as the basic shape to work with, manipulating it so that it fits each emotion.
  • I used grey for ’embarrassed’ and ‘sadness’ because both of these emotions resemble emptiness or a hopelessness, in my opinion. I rotated the triangle for ‘sadness’ because when I’m sad I feel as though ‘something isn’t right’ or is ‘off centre’. When I feel embarrassed, I want to make myself as small as possible, so I drew a very small triangle for this emotion. I accidentally drew ‘sadness’ twice, for the other version of ‘sadness’, I used blue to represent ‘feeling blue’ as the common phrase goes, and warped the triangles so that they are softened and represent tear drops. I think I should have also drew them pointing inwards to express the way we feel like hiding away when we are sad.
  • ‘Anger’ and ‘fear’ are both panicky emotions in my view. Therefore I used the colour red to represent the quality they have in common. I used the triangles to be small and spikey for ‘fear’ to represent how the heart rate quickly rises and falls. The triangles point outwards for ‘anger’ because of the sense you are ready to ‘attack’.
  • I repeated the triangles for ‘confusion’ and had them pointing randomly. This is to express your thoughts when you are confused and don’t know what direction to focus on. I coloured them black because of when you are ‘in the dark’ about something, it means you are lacking information. This could make someone confused.
  • I widened the triangle for ‘calm’ to express that melting feeling you have when you are relaxing. Green has been proven to be one of the most relaxing colours which is why some waiting rooms are painted green. I repeated the triangles moving outwards to create an effect like rays of sunshine or calming beta rays.
  • ‘Happiness’ is a straight-forward yellow triangle that shines brightly. It’s warm and bold with an open-ness at the centre, since people who are happy are usually generous and open to expressing themselves as well as having empathy to others.
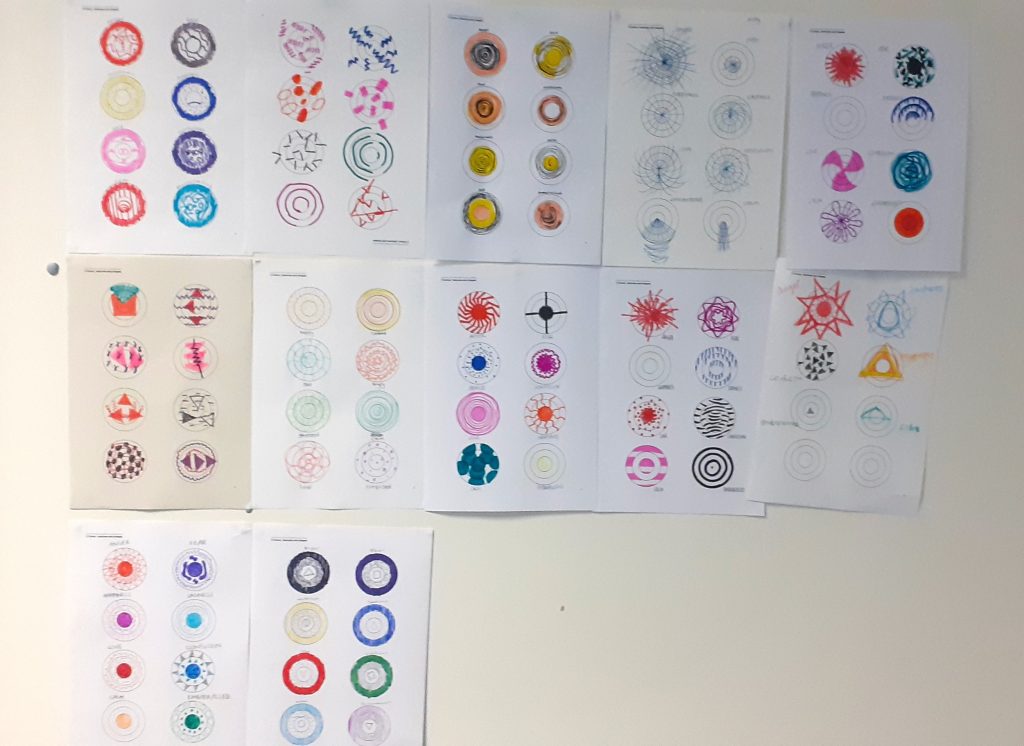
Looking at the class’ work all together allowed me to see other ways of interpreting the same emotions visually.

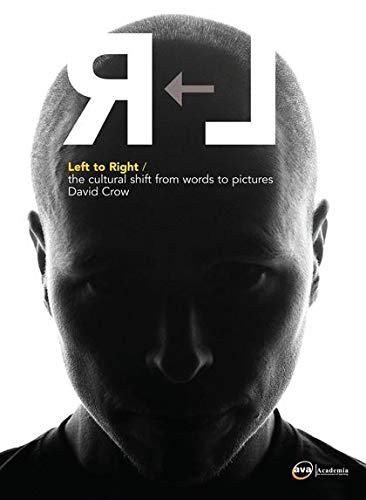
Left to Right by David Crow

I read a section of the book Left to Right by David Crow. This is a book about visual culture. David Crow was a graphic designer and Pro Vice chancellor of UAL, up until his death in June this year.

The book looks at the shift from the written word to image in our everyday experience/ mass media. It also introduces us to the politics of language, for example how the rise of literacy played a part in the subjugation of women and feminine thinking.

Book cover for Left to Right by David Crow
  • Language has evolved from culturally specific roots i.e. the Japanese character for picture, combines the symbol for ‘threads’ and ‘to draw together’ > this is a reference to textile production. This demonstrates the relationship between language and technology.
  • In Chinese script, this is still the case, for e.g. Male = Strength + Paddyfield. This reflects the history of the culture which the script originates from.
Chinese characters.
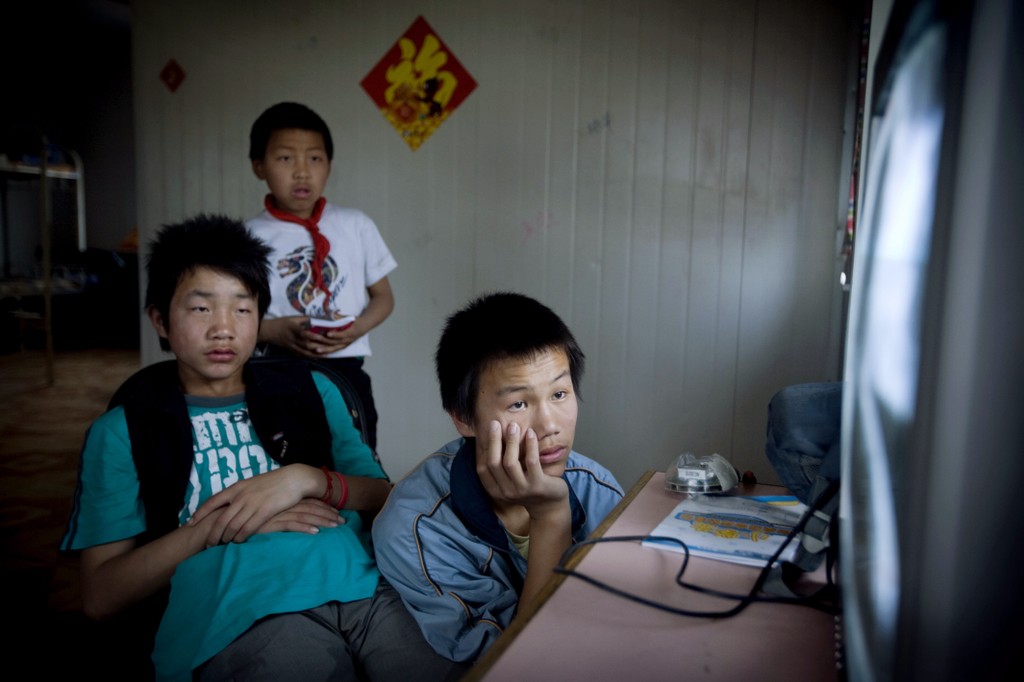
  • Television= ‘The single most potent technological innovation since the printing press’. Television changed the way we generate language and consume information. Reading was a more solitary activity- the television allows us to receive information in groups, e.g. a family gathered around a TV. This invention produces a way of reading images unlike what books could provide.
Young boys watch television at Sun Village Orphanage Home.

Shifting from Left to Right side of the brain

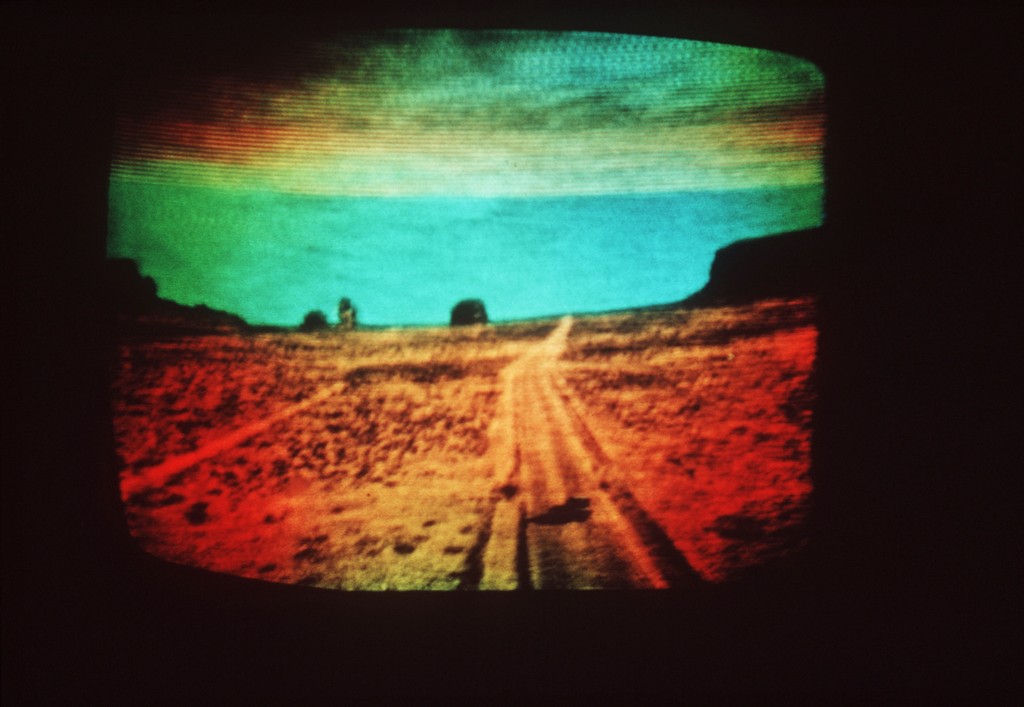
When we read, our brains have to translate the words from symbols into an image, this is a longer process than seeing the image immediately on a screen for example.

The development of screen-based media has increased image-based use of language. The shift away from the alphabet-based language has left language makers, such as designers, artists, authors and schools, needing to re-assess how they communicate to a new generation who are used to this new way of reading/ taking in information.

Television Broadcast, 1972.

The written word has been the primary tool in communication for a long time. It has the advantage of being able to get across specific details in an unrivalled way.

…However, pictorial communication has other advantages.

  1. To speak across language barriers
  2. It’s cheaper to share across the world
  3. It’s quicker to share across the world

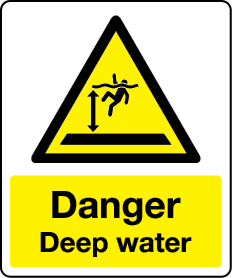
e.g. images on warning signs can be affective where language might fail to keep people safe.

1990’s

Technology in the early 1990’s allowed designers to design typefaces digitally and this meant a boom in design houses whose main focus was on designing and distributing typefaces- increasing the interest in post-modern theory.

These designers were experimental with the software, coming up with a new conceptual framework. Art schools and graphic design courses were beginning to look at semiotics and linguistics. The designer was looking to create a new relationship with the keyboard. This was a turning point. From this period, it seems that our visual landscape is being pushed towards the image.

Glossary of terms

From Left to Right, David Crow

The Origins of Writing

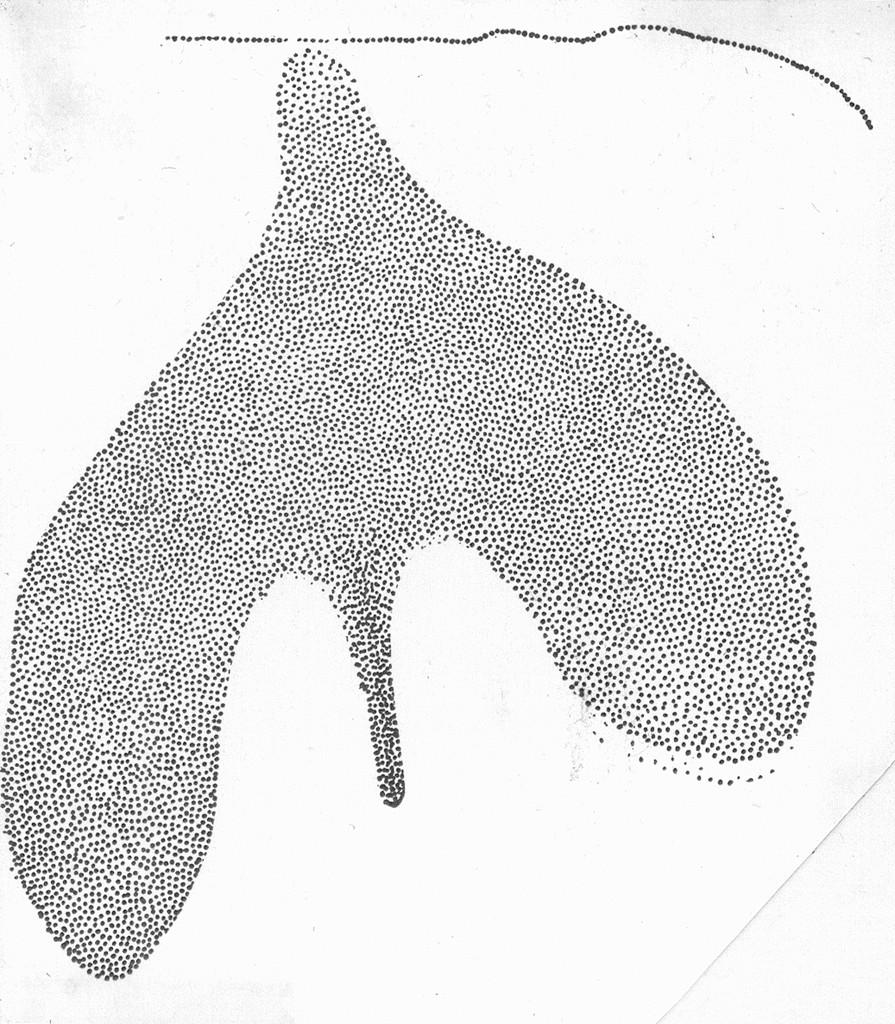
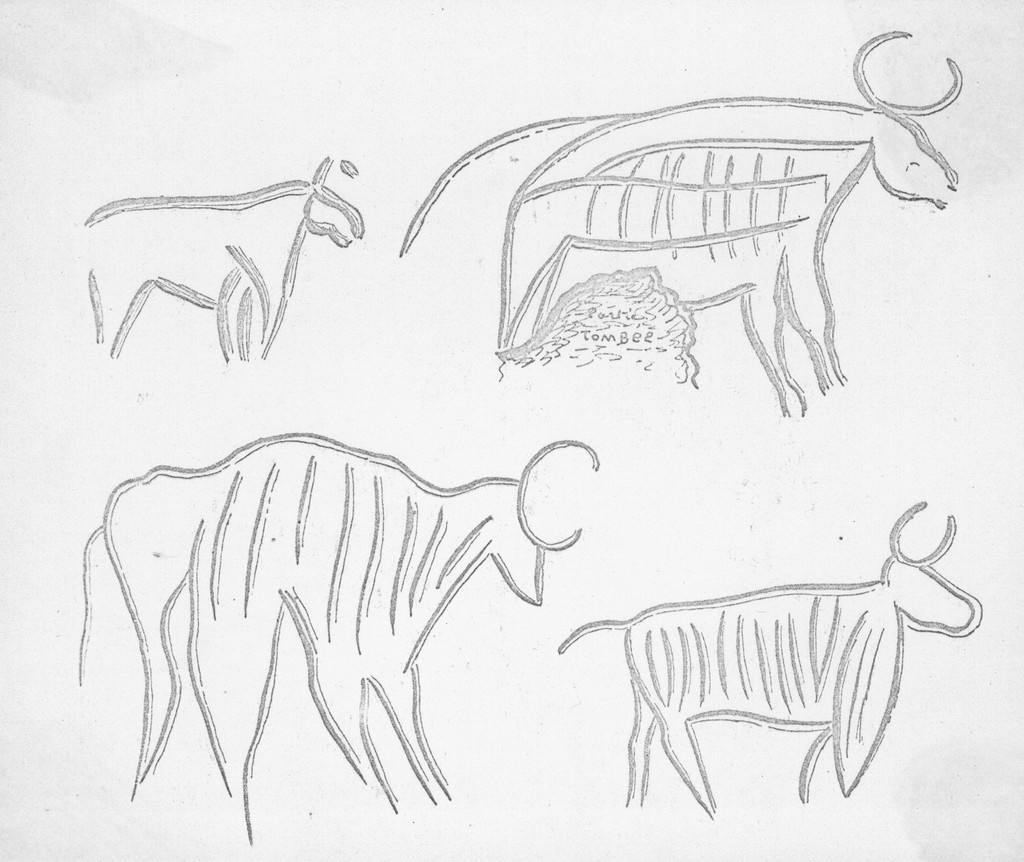
Ice age wall drawings are described by Adrian Frutiger as ‘an early attempt to visualise language’. It is thought that these drawings were only a part of the communication between people. They are the part that remain as a record of these ancient peoples. The body was used as a reference very often. These pictorial signs can be described as ‘protowriting’.

Ice age wall painting, thought to be a bisexual symbol.

Writing originally was needed to make a record of the exchange of goods.

Ice age painting on a clay wall, drawn with fingers, subject: oxen

Connecting writing with sound

A rebus communicates more detail than simply pictographic script. It represents sound associated with an icon. E.g. the image of a bee to indicate the Roman letter ‘B’.

James Francois Champollion discovered hieroglyphics were a mixture of semantic and phonetic signs.

Utopian Ideals

17th century philosopher Gottfried Wilhelm Von Leibruz imagined a writing system using images to describe human communication. The idea was that it would avoid the use of the alphabet and therefore, would be able to span across all languages. (Similar to how music is understood universally).

Sound and thought cannot be divided.

Saussure & Andrew Robinson, The Story of Writing

The meaning of a pictogram is likely to change from reader to reader, due to the individual’s cultural background. Pictograms are too open to interpret specific details. They lack sound and therefore, precision.

Isotype Institute

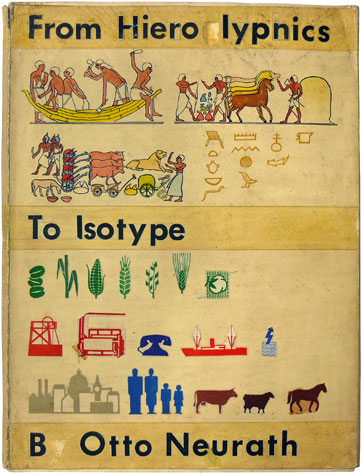
Otto Neurath was a Viennese philosopher and sound scientist. He came up with another pictorial writing system. His intention was that it would be:

  1. visually appealing and
  2. easily accessible.

This is because he needed it to be understood by a wide range of people across Austrian society. It became popular and was used to present public information.

  • In 1936, this language was renamed ‘International System of Typographic Picture Education’ or ISOTYPE.
  • In Oxford, Otto and Marie Neurath founded the Isotype Institute. The aim: ‘International promotion of visual education.’
  • Symbols of people, places, objects and actions were used in educational material.
  • They produced films, leaflets, posters etc for the Ministry of Information during the Second World War.
  • This pictorial language was intended to remove hierarchies and create ‘greater human happiness.’
from Only an Ocean Between, 1943

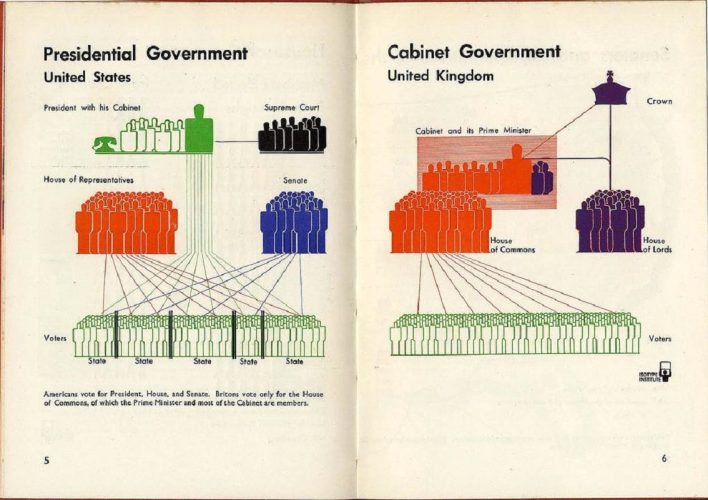
Personally, I find that these charts make the statistics easier to understand. One example is the charts made on the structure of the British government. They are able to simplify a system I find too complicated to understand when someone explains it verbally to me. (example below)

https://alphaomegatranslations.com/business-translation/translation-and-universal-icons/
  • Isotype= alternative to written and verbal communication. It focused on out commonality rather than our differences, being an international language.
  • The First World War highlighted the political nature of language.
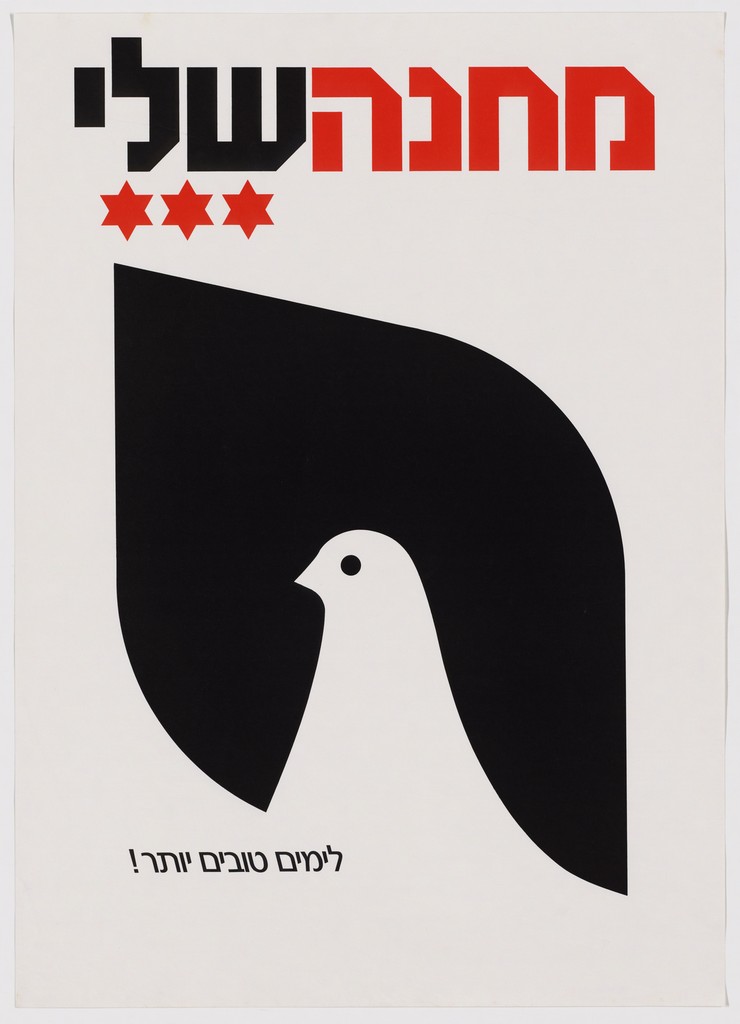
The Shelly Camp, For Better Days!‘, Yarom Vardimon (1981). It was the main election poster for the Shelly Camp, a political party in Isreal.
  • Neurath was inspired by ancient picture writing systems, this inspired him to use few words in his system. He found words to be more immediate and forceful than words.
  • Their work grew from what they saw as a genuine social need to reconstruct Vienna after the war’s destruction of the city.
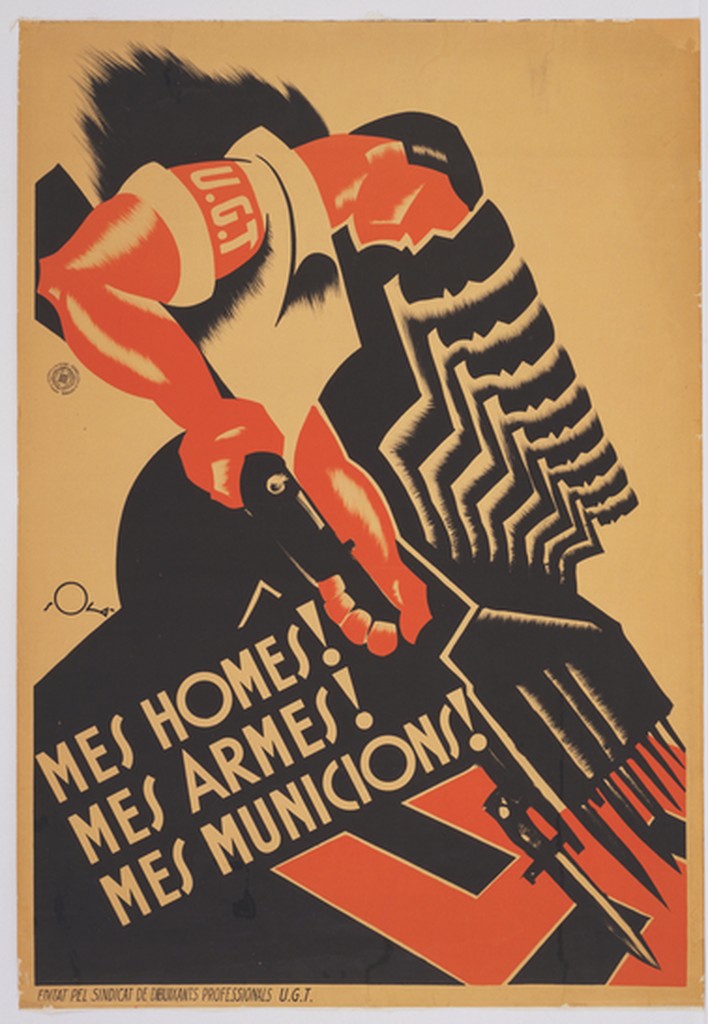
Political poster, 1936
(More Men! More Weapons! More Munitions!)

The Politics of Writing

The appearance of writing is linked with the appearance of hierarchical societies- even ancient scripts were used for propaganda. (Having authority over a group of people).

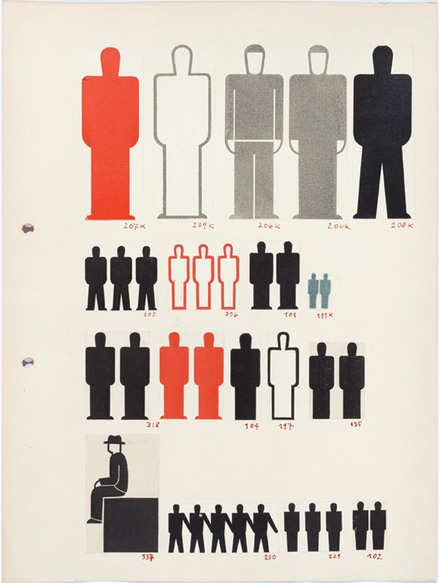
The Principles of Isotype Symbols

  • Neurath’s communication system was rooted in linguistics.
  • Images were intentionally mechanical for easy and quick reproduction.
  • The symbols were created by cutting the shapes from coloured paper.
  • They were then developed into letterpress blocks. This allowed them to be printed in different colours and sizes.
  • Isotype symbols are simple, geometric, with a machine aesthetic, echoing the industrial design/ architecture of the time.
  • He was in contact with the Bauhaus and friends with graphic design’s leading figures of the time- El Lissitzky and Jan Tschichold.
  • He was focusing on designing for the future.
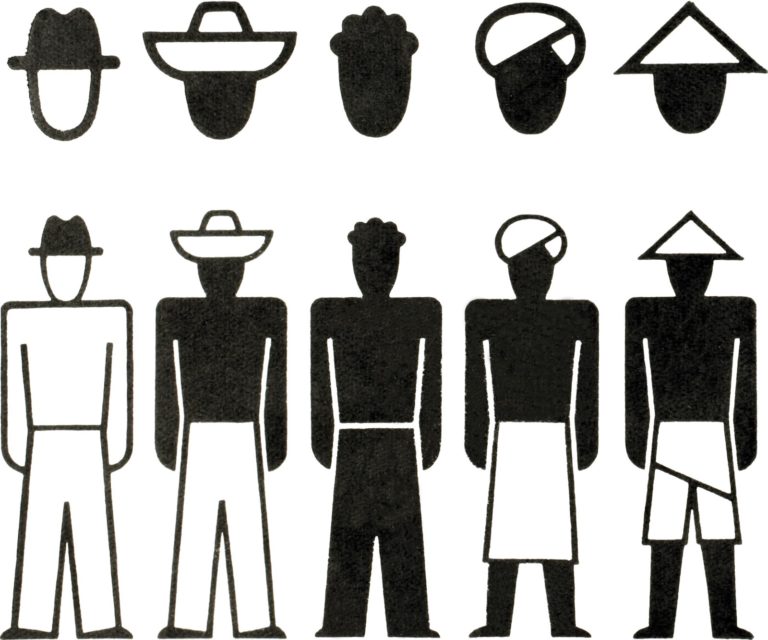
Isotype Society Archive- Signs for the 5 groups of men.

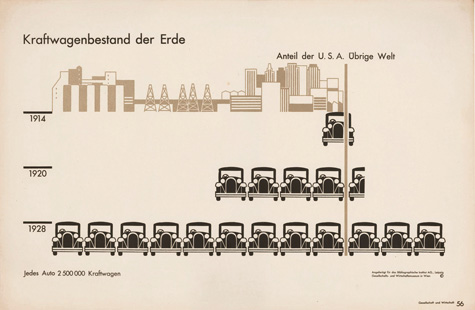
Neurath had the intention of timeless design, but some have dated. For example, his symbol of a car is old-fashioned now (below). He knew they might date and acknowledged this. They have mostly stood up well against the test of time.

‘Numbers of motor vehicles in the world’ (USA and rest of the world). Even if one cannot read German, the subject reveals itself through the ‘speaking signs’ of the automobiles, each of which represents 2.5 million vehicles.

Neurath found that a sense of perspective in these images was unimportant. He instead decided on silhouette drawings.

Isometric projection= objects in foreground and background appear to be the same size.

Isotype & Colour

Specific colours were assigned to specific objects, for example men painted darker than women. The colour and tone are applied strategically, similar to Egyptian wall paintings.

Isotype used 7 colours: white, blue, green, yellow, red, brown & black.

Some colours were also sometimes mixed e.g. the red and yellow to create orange.

Assigned meanings:

Red > metal industries

Blue > textiles

Green > wood

(The system could be adapted for situations where only 2 colours are available.)

https://hyphenpress.co.uk/journal/article/copyright_in_isotype_work

Isotype & Linguistics

https://hyphenpress.co.uk/subjects/Hyphen%20news

Isotype is designed as a ‘digital language’, as in the alphabet we use. This means there is a fixed number of signs in the Isotype language system.

It is designed to be read from right to left and top to bottom. For example, the symbol that has a bell on the left and symbol for porter on the right, indicates the bell is used to call for a waiter. Changing the right-hand symbol would change the message to bell to call for ________.

Neurath acknowledged the value of using age-old symbols, such as the sickle to represent agriculture, since even though not used as an instrument today, these symbols are deep in the collective consciousness.

The arbitrary nature of language can sometimes fail in helping people comprehend a meaning, for example, the word ‘man’ bears no resemblance to a man. The Isotype symbol of a man however, resembles a man visually, making it practical/ successful as a symbol.

The picture language was not intended to replace written language, since symbols aren’t the most effective way of expressing emotions, feelings, giving orders etc.

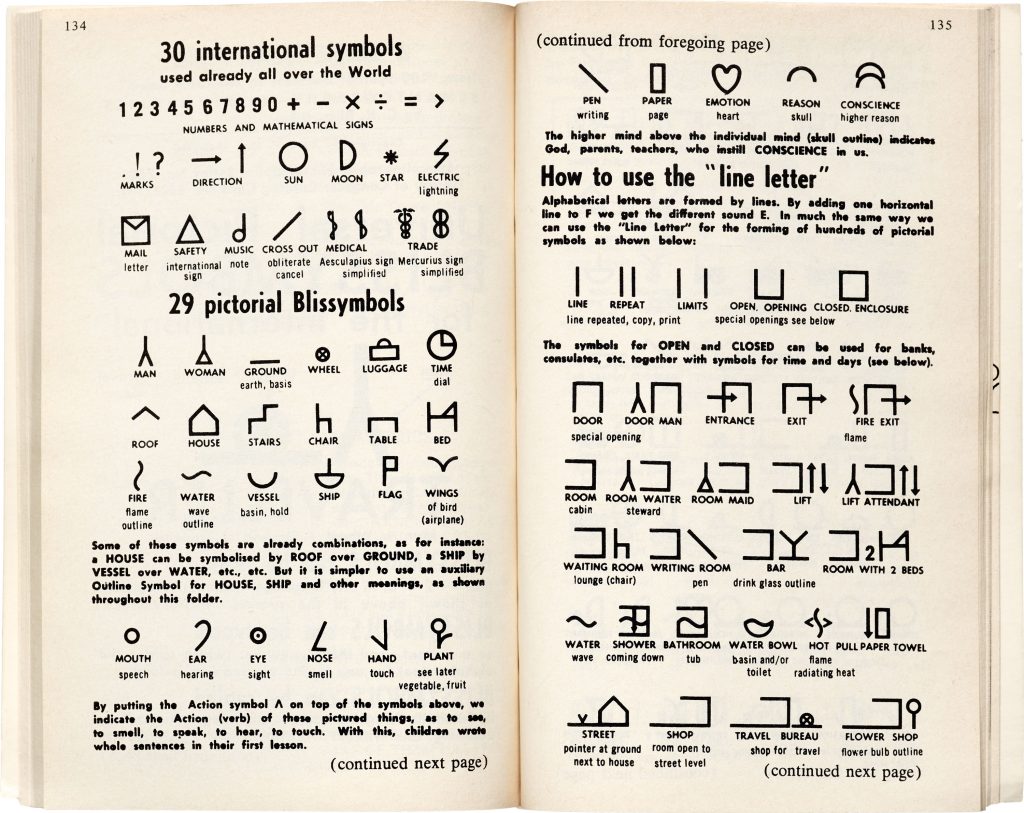
Blissymbolics/ Semantography/ The Visual Language of C.K.Bliss

https://www.blissymbolics.org/

Also beginning in Vienna, Karl Kasiel Blitz (Bliss) was dissatisfied with the language used for science- he felt the language was a barrier for understanding. He experienced the problem of language during his childhood on the Russian border.

He was more drawn to/ comfortable with the blueprint images found in his father’s work as an electrician, e.g. symbols for bulbs, batteries, switches etc. He felt these were more logical compared to the alphabet.

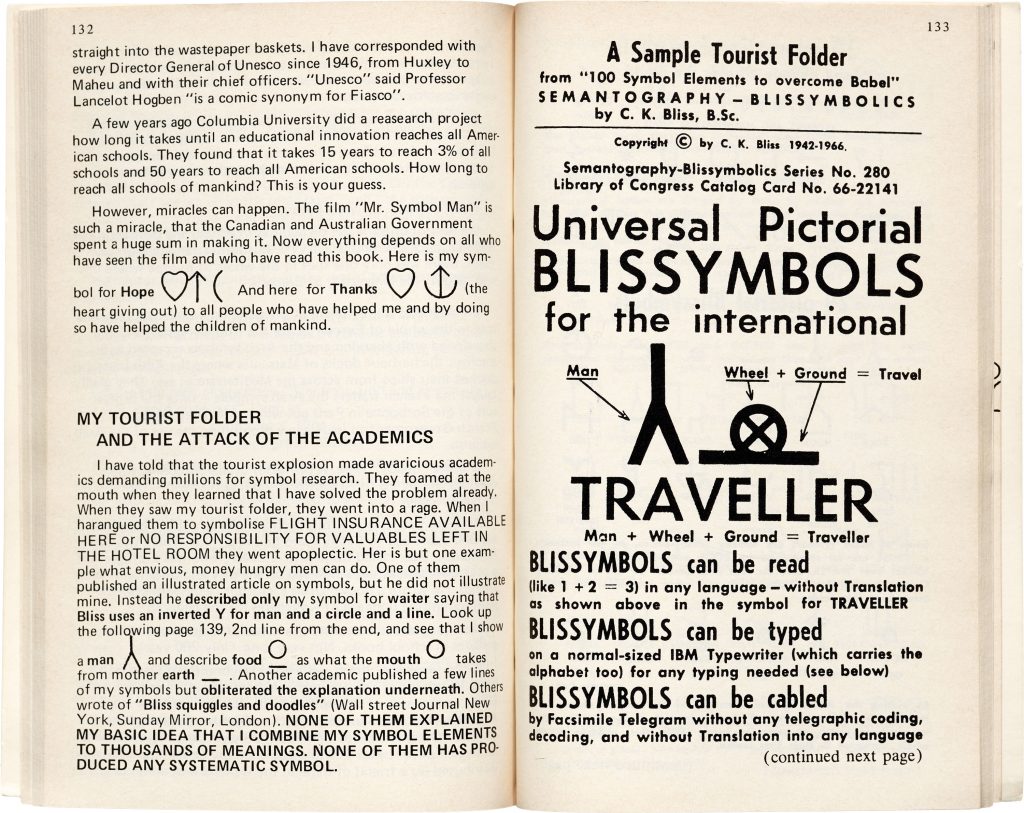
Bliss came across Chinese script while in Shanghai- he was fascinated by its complexity. He later came up with ‘Semantography’, which was his version of an international language of symbols. This language combined 100 symbol elements.

The Book to the Film ‘Mr. Symbol Man’

The tourist industry boom around 1965 made his work relevant. (People found blissymbols useful because it bridged language barriers). However, he was often not credited with this work when research pages were written on pictorial symbols.

The 1970’s saw his work used in communication for children with speech and physical impairment, by the Canadian teacher Shirley McNaughton. This was documented in the film Mr Symbol Man.

In 1975, Blitz was nominated for a Nobel Peace Prize as a result of his work. This work being for ‘Services to the community’ (children with learning difficulties).

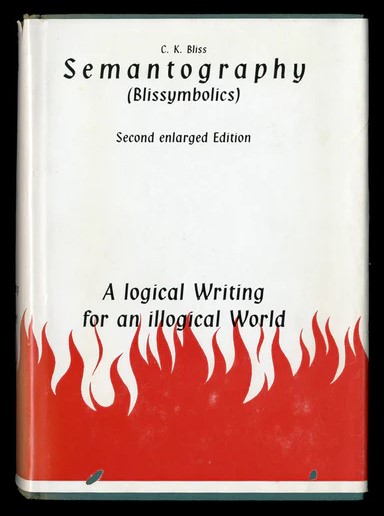
An excerpt from Bliss’ book, Semantography: A Logical Writing for an illogical World

Neurath and Bliss were motivated by personal experience. Bliss, by his experience of WWII. He saw language being used to control people, this is why he wanted to create an alternative.

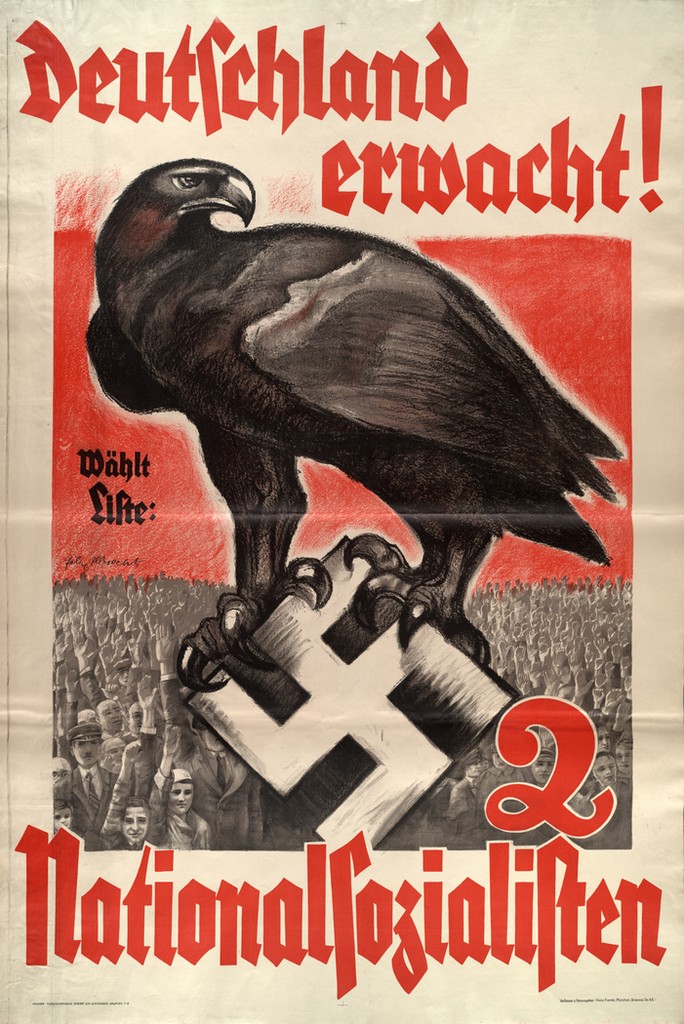
Election poster with drawing of eagle, the state’s symbol, on a swastika, before a large crowd of mostly young people and students (fraternity-uniforms), in posture of the Hitler-salute, (1933)

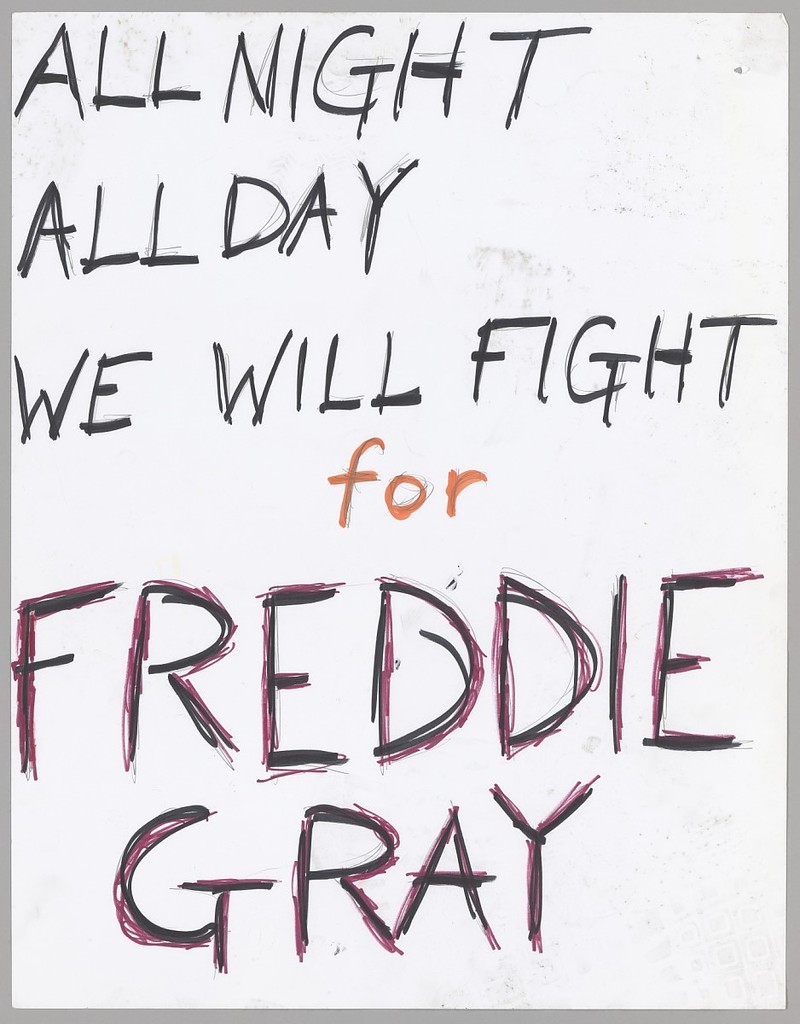
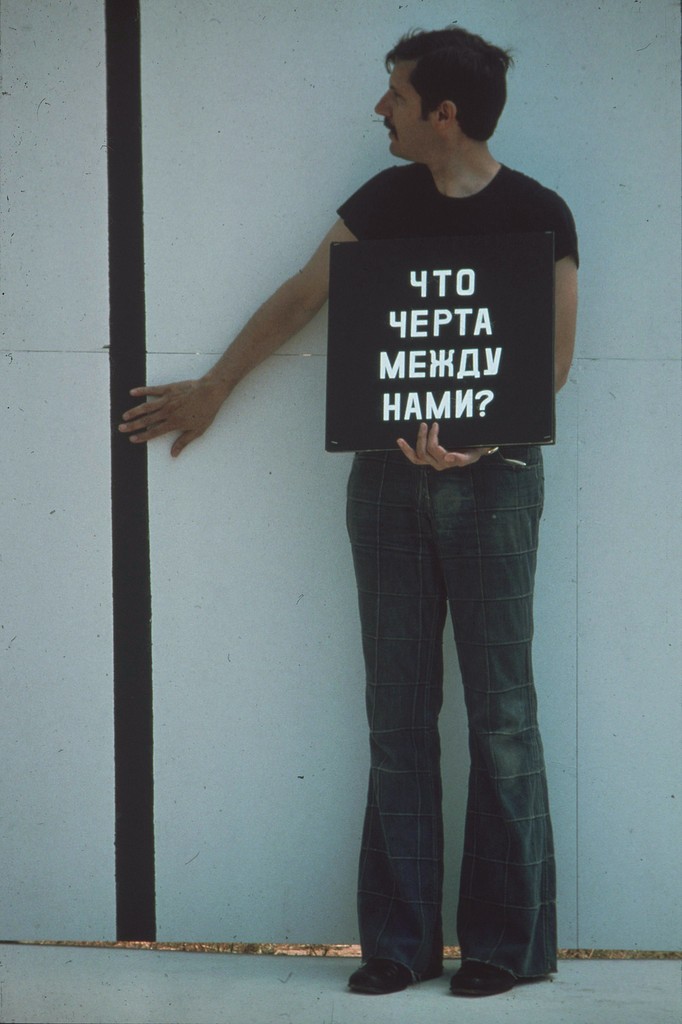
Words serve as a useful tool for making a political statement, since they can express specific details and do not require drawing skill:

Questions New York Moscow Part II: What is the Line Between Us?, Douglas Davis, 1976 (During the Cold War).

Bliss’ aim was for effective communication. He had the ‘original desire to design something that would improve people’s lives.’

Using simple shapes makes the symbols easy and quick to draw.

Blissymbolics consist of:

  • Basic geometric shapes: circle, square etc
  • Additional shapes: heart, house, chair
  • Arrows and pointers (in 4 directions)
  • Arabic numerals
  • Standard punctuation marks

Guidelines published by BCI- The Fundamental Rules of Bissymbolics: The marks are arranged on a matrix square with earthline, midline and skyline.

Blissymbolics/ Linguistics

Similarity between Isotype and Blissymbolics:

  • Improving human experience and breaking down linguistic barriers.
Difference:

  • Bliss claims his system as a language, whereas Neurath saw his system to work alongside text.

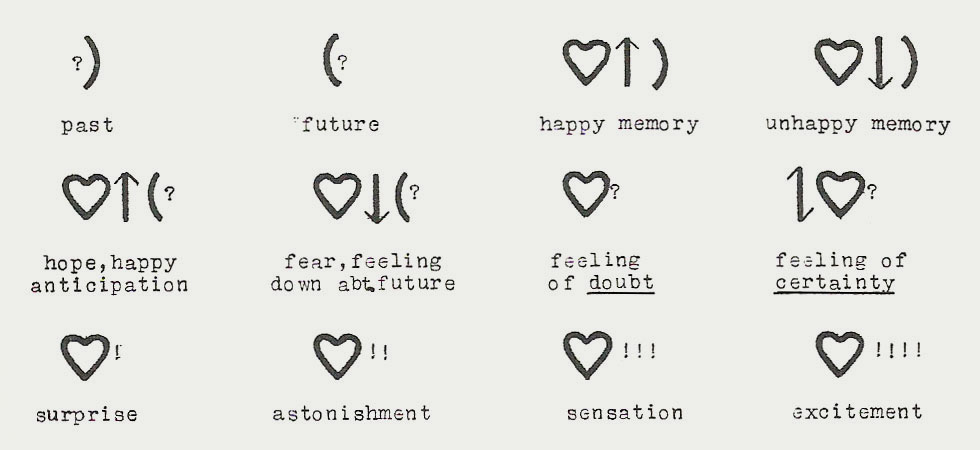
The mixed reaction to Blissymbolics was due to its ambitious claim to be its own language. Blissymbolics requires readers to learn the symbols prior. The system is a mixture of iconic signs, ideographic signs and arbitrary signs. The size of the sign is also significant.
Larger circle = sun

smaller circle = mouth

It is inflexible as a language. Any changes have to be approved by the BCI – not allowing the language to develop organically as would be the case with most languages. But the logic behind the symbolism has been called ‘charming’, ‘admirable’ and ‘interesting’ by critics. It is easier to appreciate this system as a set of symbols and ideographic pictures.

example:

Cool= slang + ice

Adrian Frutiger

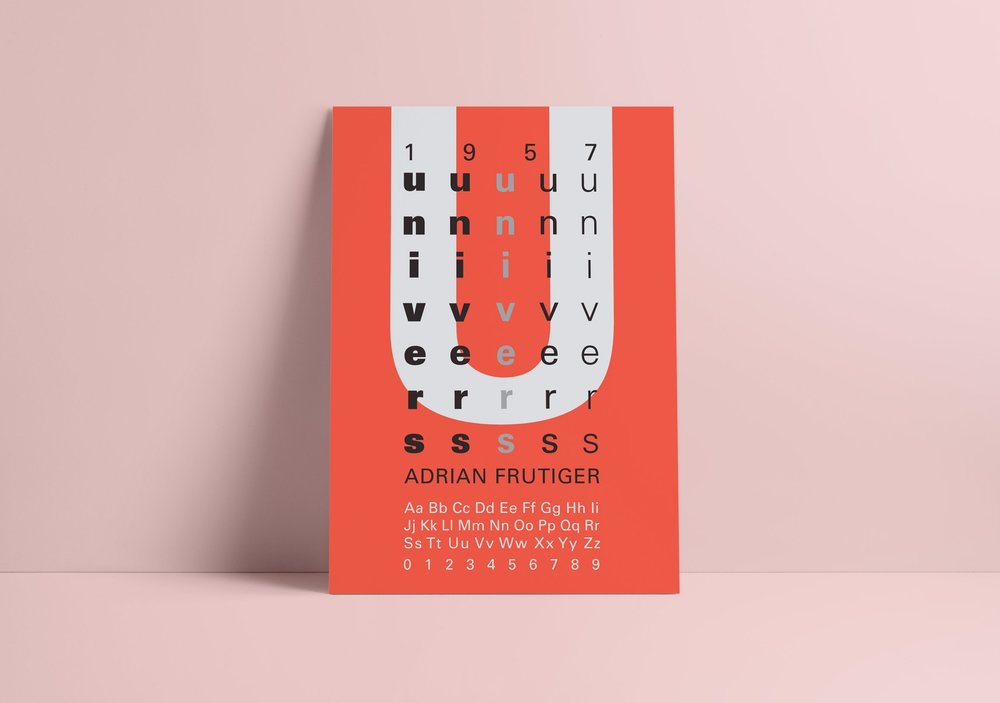
Typographer and designer for international corporations, Adrian Frutiger designed Univers, the widely used corporate typeface:

Univers poster by Rokaya Shenasa
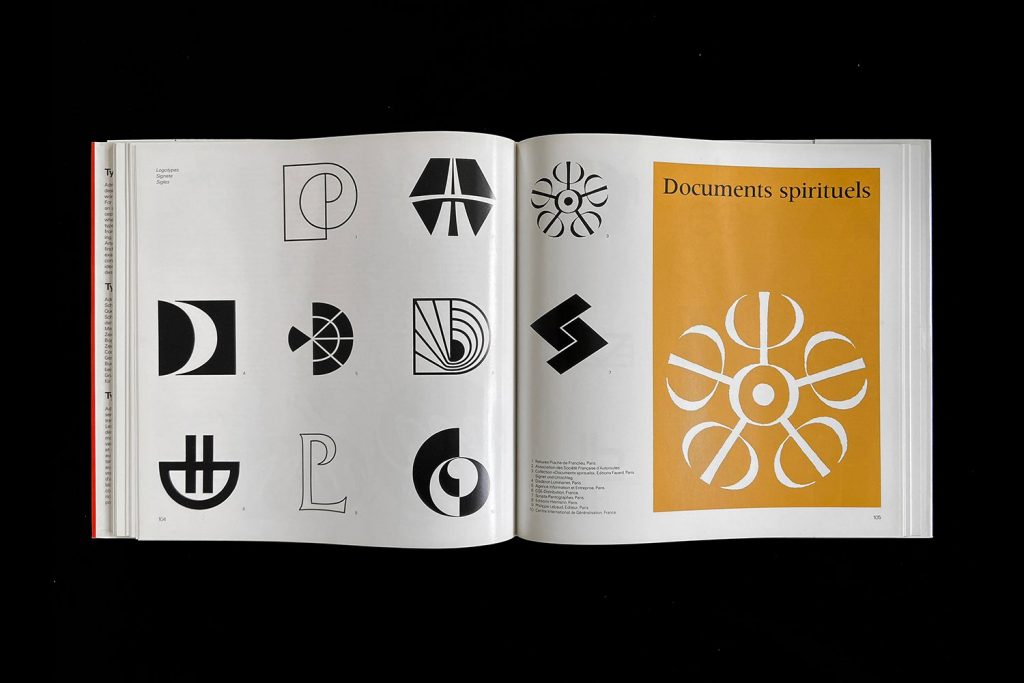
Type, Sign, Symbol by Adrian Frutiger (1980)

In his work, he needed to consider international communication issues. He designed pictograms to accompany his typefaces. His work with exploring the Indian script of Devanagari, allowed him to explore cultural context as well as letterforms.

Frutiger’s pictorial script is symbolic and needs to be learnt, unlike Isotype signs, which are more intuitive since they represent the object visually. Frutiger’s symbols are more abstract and based around ‘life, love and death’.

The reader needs to understand the basic code of the symbols, so they can understand the meanings based on the sign’s scale and position. Some metaphor is also used.

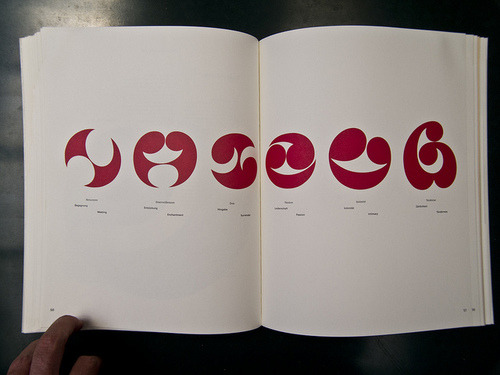
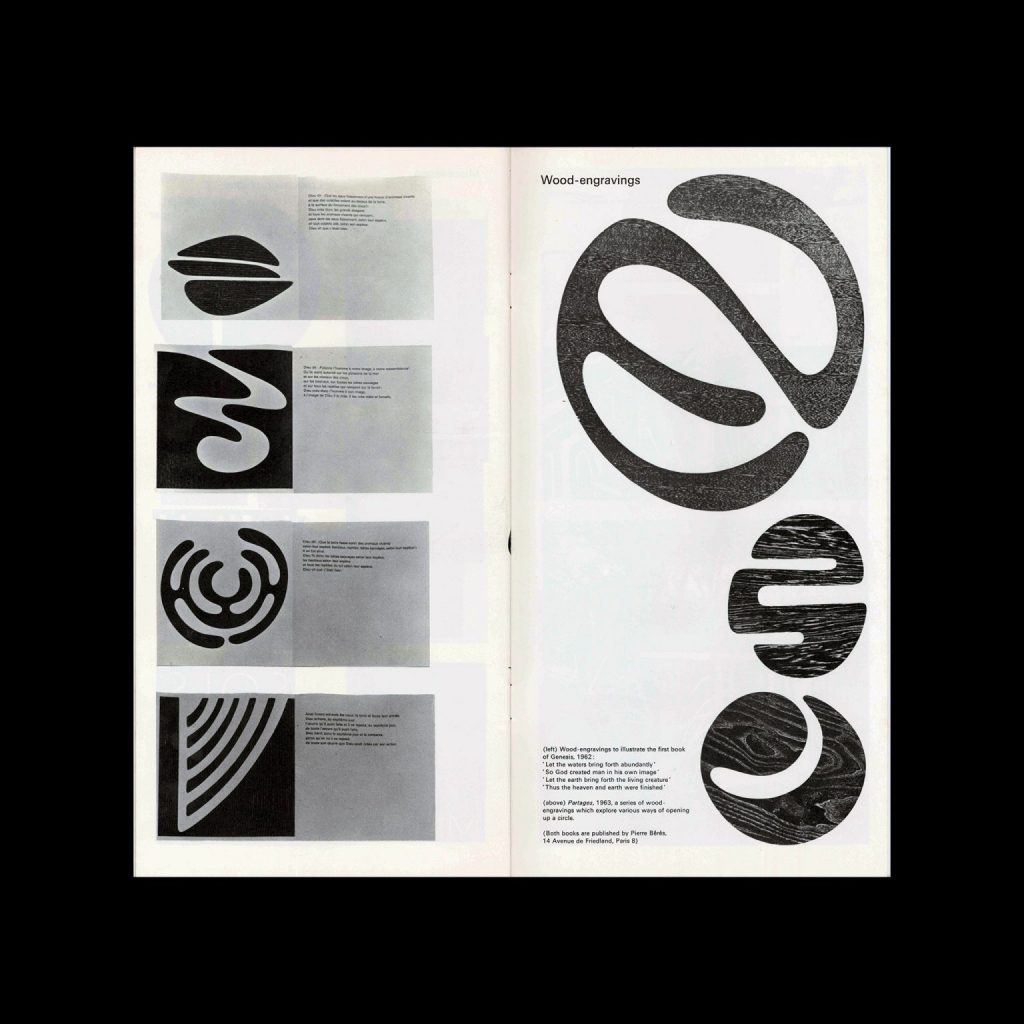
Graphismes by Frutiger, Monotype House, 1964

These symbols have been described as beautifully balanced symbolic marks, reminiscent of 20th century artists, the likes of Miro, Klee and Picasso. I have to agree. Using scissors and paper as tools enabled the artist to create shapes that flow, since the artist is not able to control the line very well.

These shapes are signs because each is distinct yet they are similar enough to be visibly connected. His experience in type design gave his symbols ‘economy of form’.

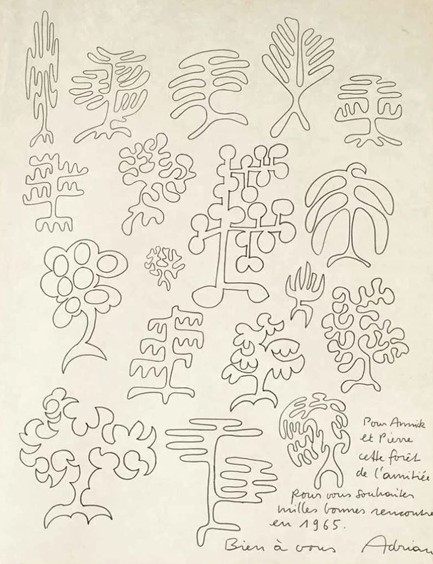
Frutiger also developed sequential drawings to be read as a narrative. For example, those depicting growth and birth in the natural world. These drawings reflect the way images are shown as a sequence on screen. These signs are more iconic- the scale changes to represent the growth of the plant.

Central to Frutiger’s work is technology and its relationship to human issues – the various ways we receive information. Putting people first, improving communication in a world where the expectation/ tendency is to subordinate man to technical progress.

Language & Type (part 1)

History of Typography

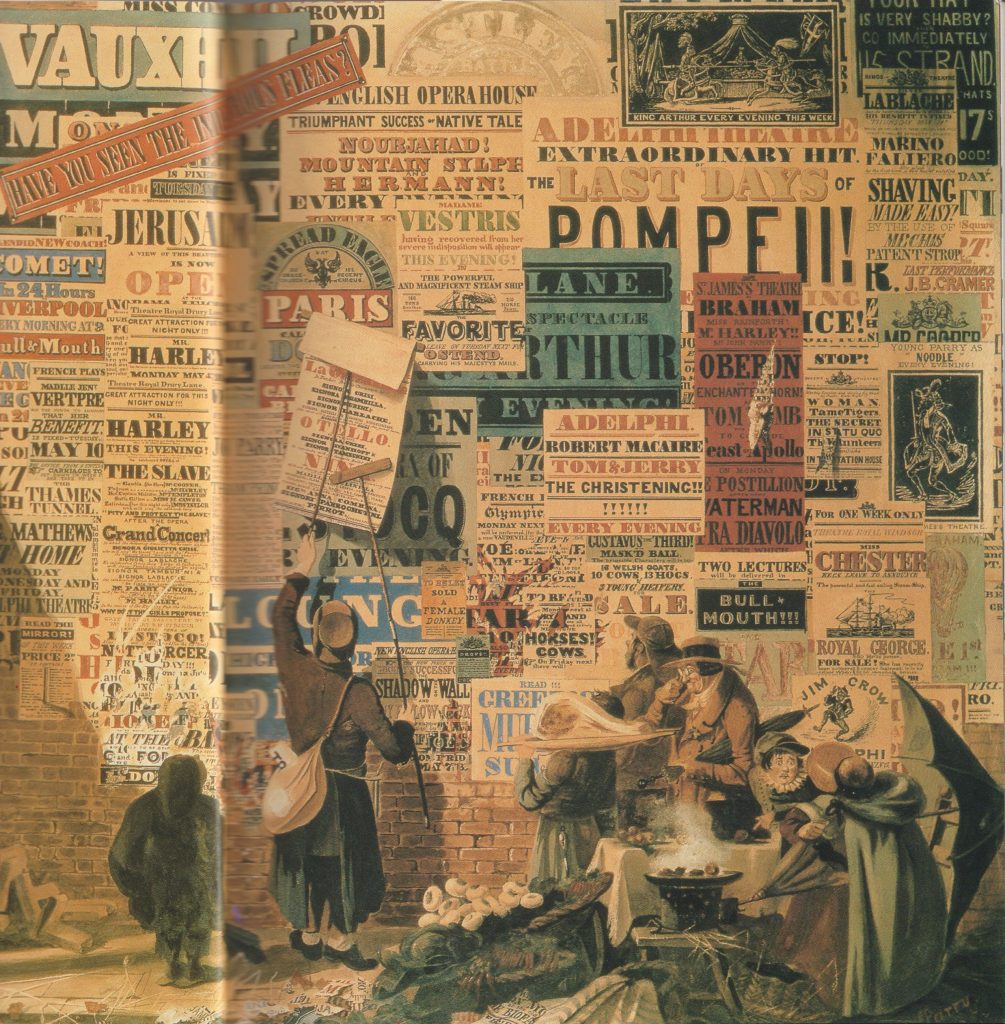
In the 19th century there was a reduction in price of printing material. This enabled people to read, which allowed a democracy. (You can’t have a modern democracy if people can’t read). This reduction in price, lead to several things:

A rise in advertising- they saw posters competing in public. A visual noise shown in the painting by John Orlando Pary of a London street scene:

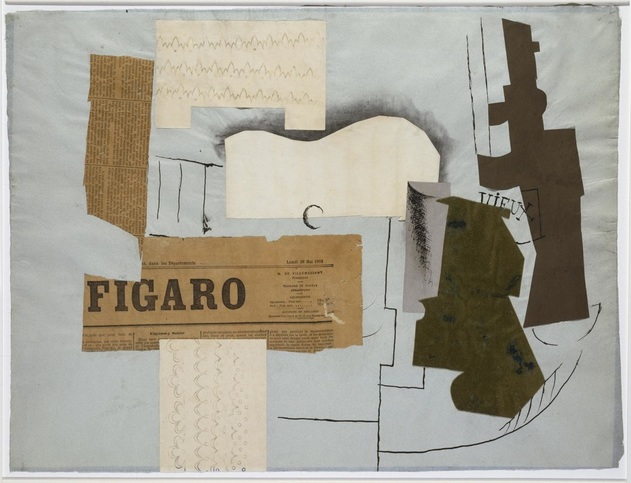
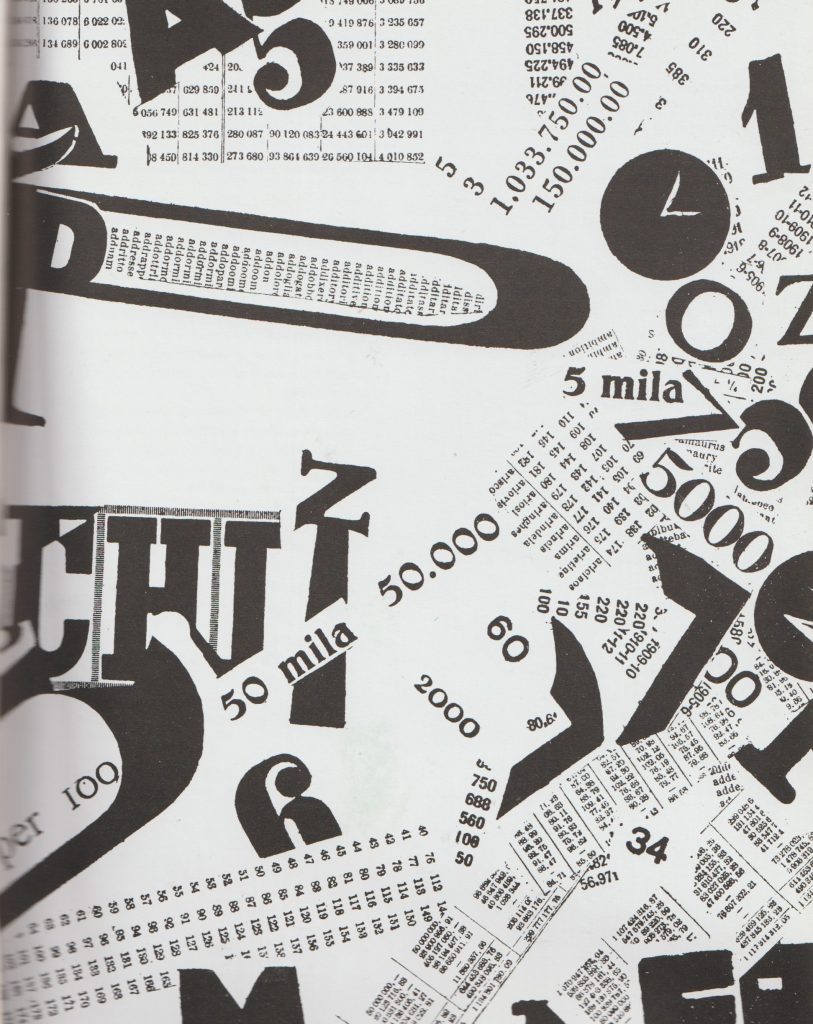
Both artists and writers saw this and were inspired. They turned to each other’s craft to enhance their work. Artists used words within their work, such as the collages by Picasso and Braque. Symbolist poetry came from writers reading the newspaper and seeing a contrast in the words about a variety of subjects.

Bottle of Vieux Marc, Glass, Guitar, and Newspaper – collage by Picasso https://www.weinerelementary.org/picasso-and-collage.html
Modernsim & Post-Modernism

“From the end of the 19th century, modernism was shaped by the industrialisation and urbanisation of western society. It marked a departure from the rural and provincial towards cosmopolitan, rejecting or overthrowing traditional values and styles as functionality and progress became key concerns as part of an attempt to move beyond the external physical representation of reality as depicted by cubism and the bauhaus.”

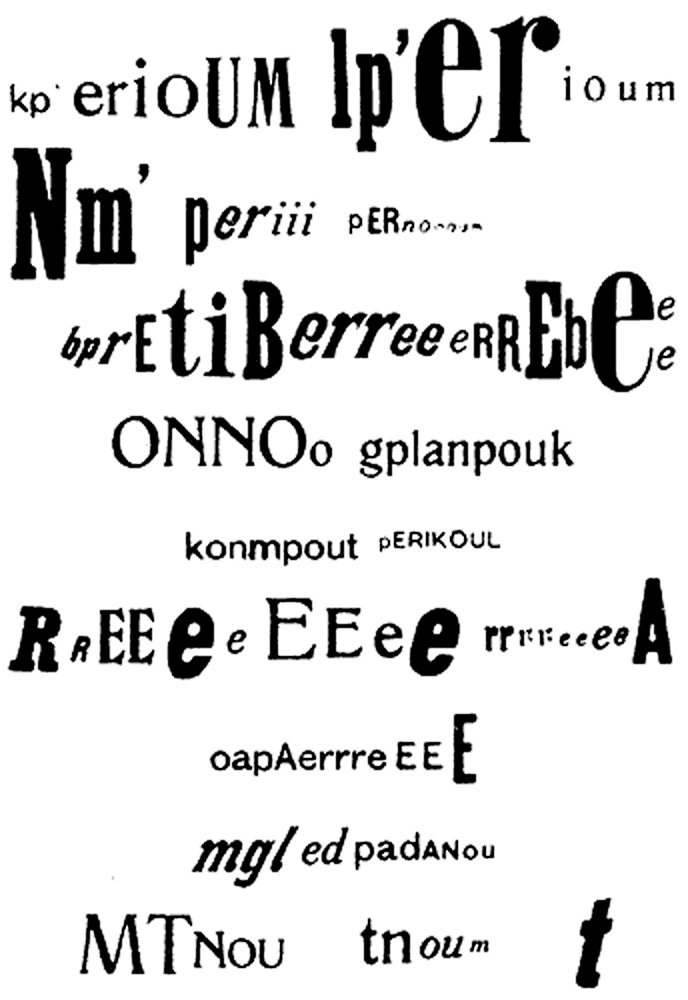
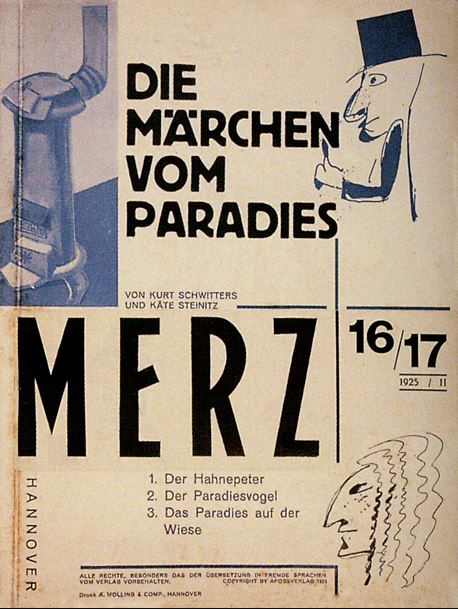
Around the 1st World War, the western world was politically heated. Dadaism and the Constructivists came out of this time. Dadaists opposed the traditional beliefs of a pro-war society.

The optophonetic of Dadaist poet Raoul Hausmann, presented by Cecile Bargues http://www.diptyqueparis-memento.com/en/dada-optophonetic/
Cover of Merz, Kurt Schwitters, 1925

During the communist revolution, the art movements within this were the Futurists in Italy and the Vorticists in Britain. Their work represented the breaking up of the old world.

https://visualartsdepartment.wordpress.com/modernism/

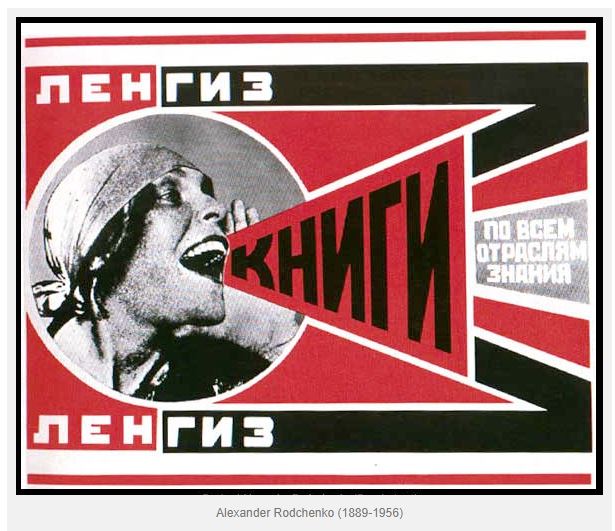
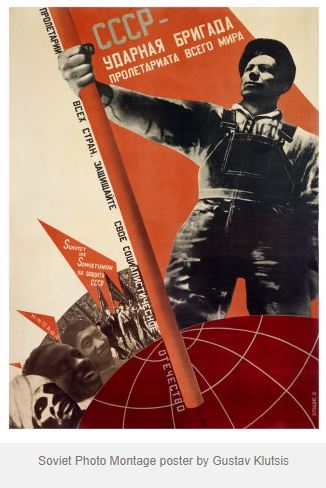
“Constructivism began as a Soviet youth movement. The Russian Revolution of 1917 involved many Russian artists, who combined political propaganda and commercial advertising in support of the new communist revolution.”

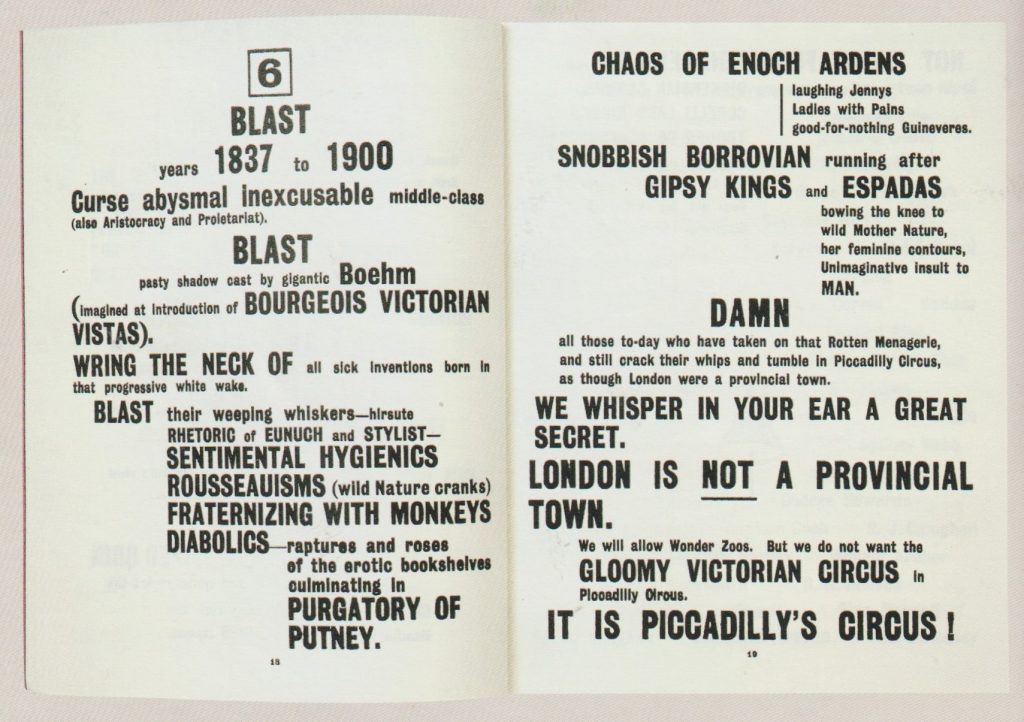
Blast

“Bless all English eyes” BLAST manifesto by the Vorticists. The harsh typography states a list of things the Vorticists were against (‘Blast’) and what they supported (‘Blessed’).

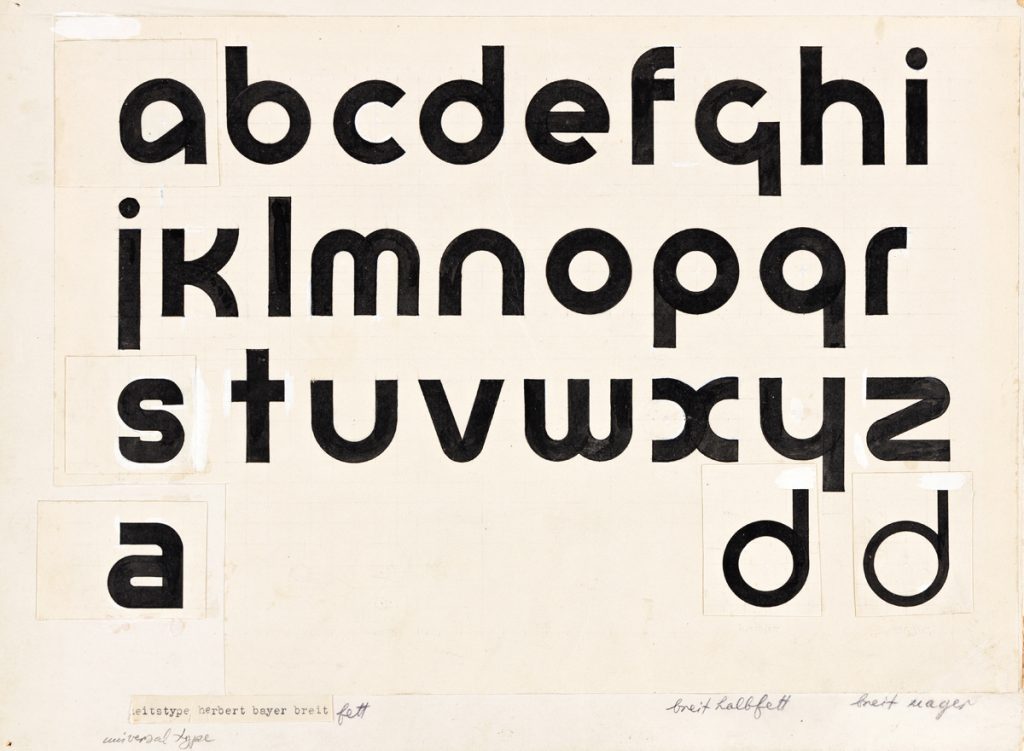
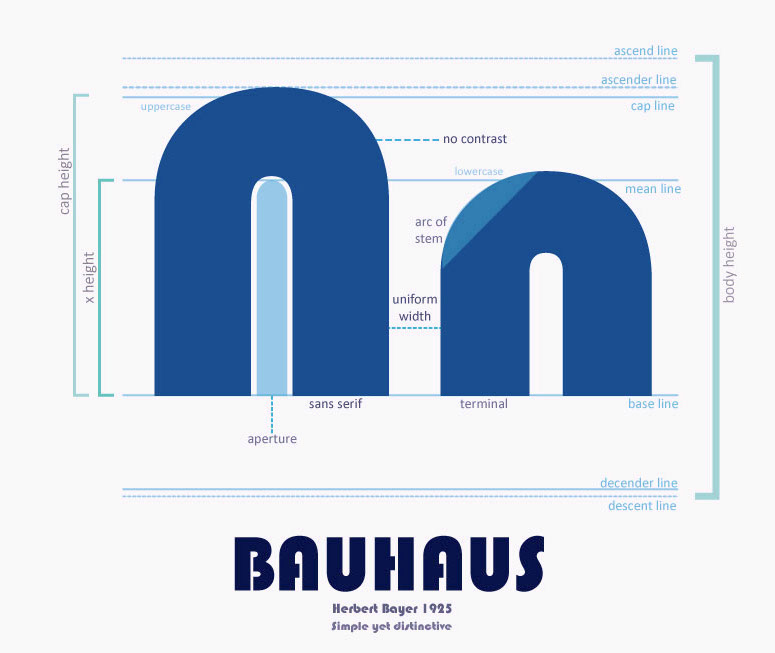
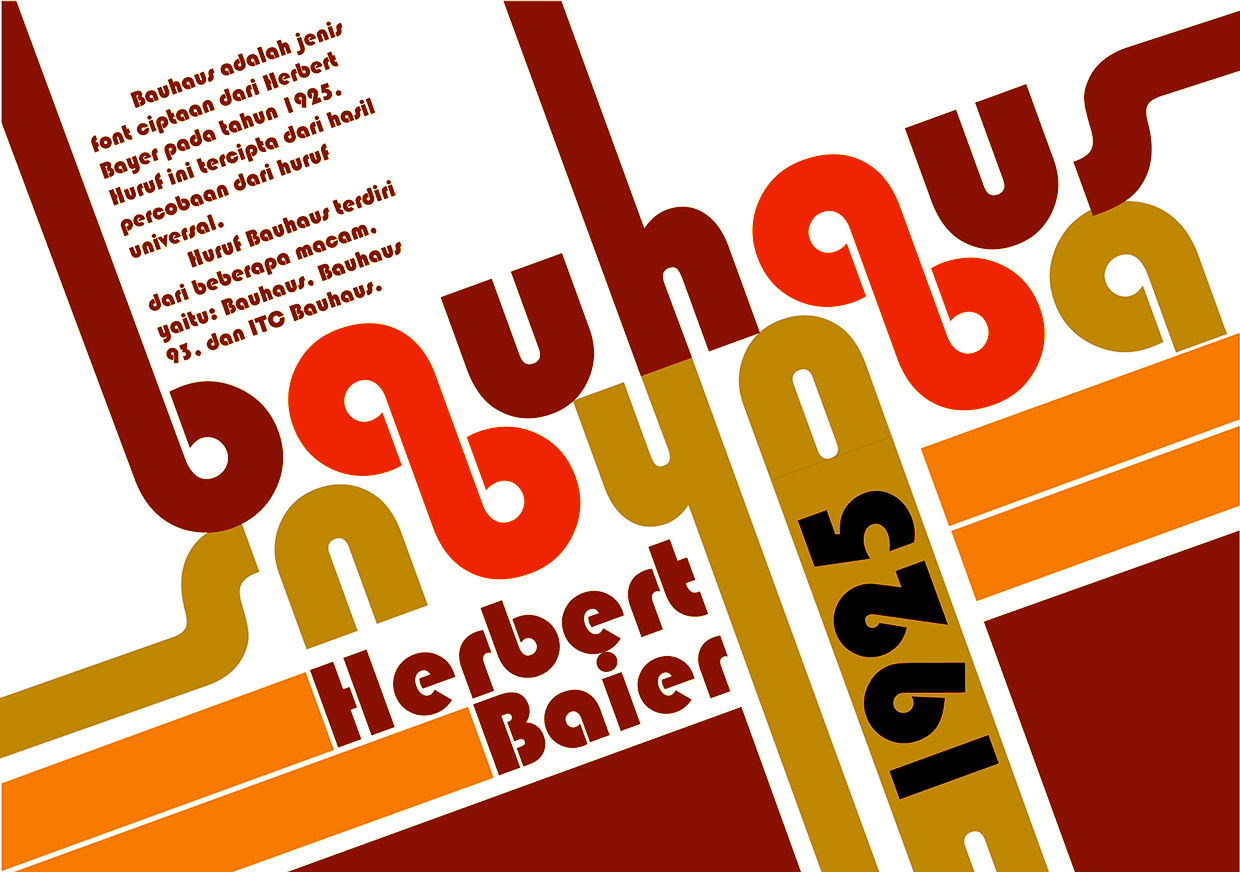
In the 1920’s, rules were written by Modernists and new typefaces were invented. This occurred at the rise of Fascism. Herbert Bayer was a designer who came up with the ‘Universal’ typeface, that he planned to be used by everyone, in a way of re-writing tradition. By changing what the world looks like, people are introduced to the new as it surrounds them in everyday life. This typeface at the time was extremely new and surprising.

Universal, 1925, Herbert Bayer

“Bayer’s Universal typeface was developed at the Bauhaus and is a reduction of Roman forms to simple geometric shapes. The circular form features heavily, and you can see how each character is closely based on the others.”The Fundamentals of Creative Design by Gavin Ambrose and Paul Harris

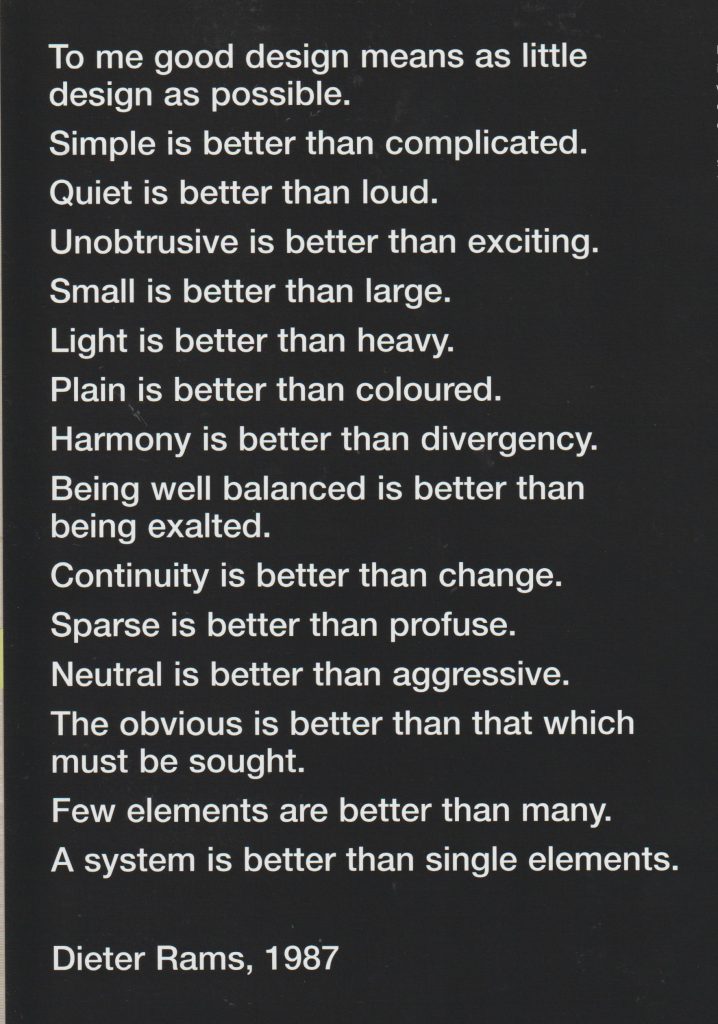
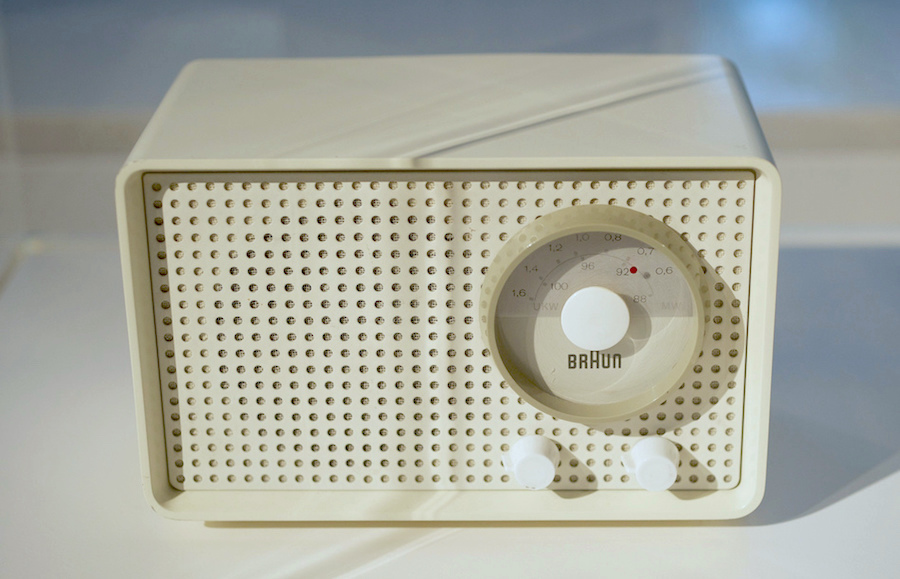
Radio design by Dieter Rams. His work was described as ‘quiet simplicity’. He was a pioneer of the Modernist movement and worked for Braun.

Jan Tschichold

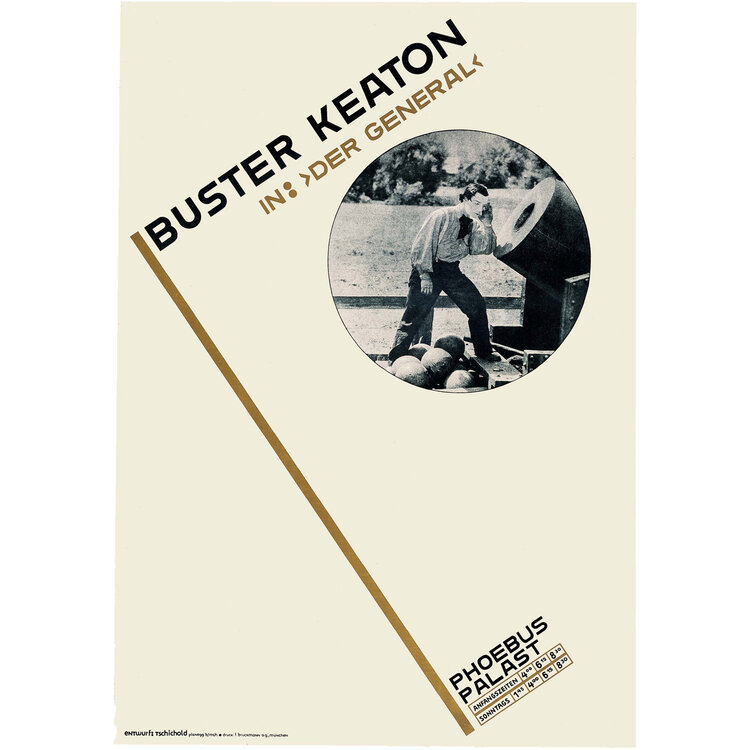
Poster, Buster Keaton in “Der General”, 1927
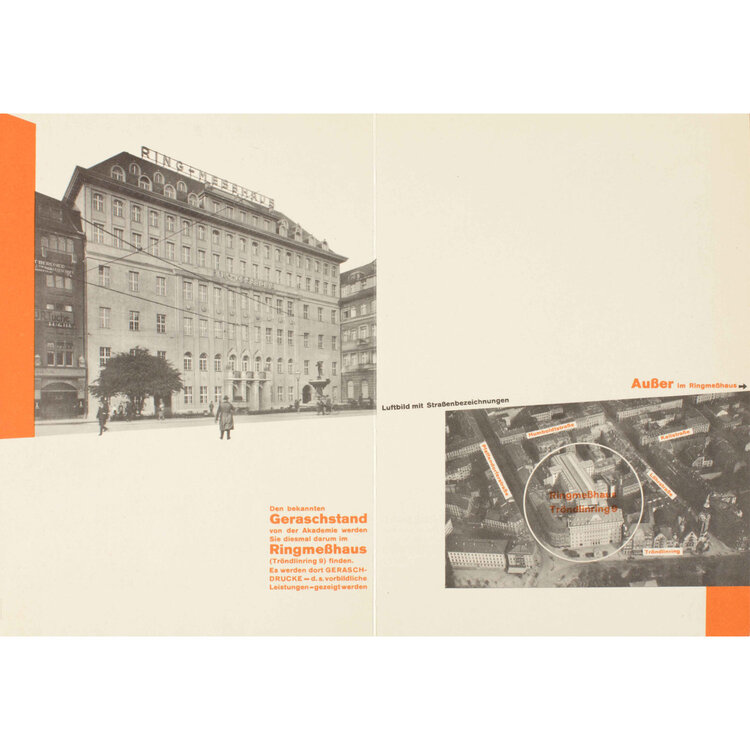
Internal spread from brochure Merken Sie sich bitte: Die Reklamemesse, 1927

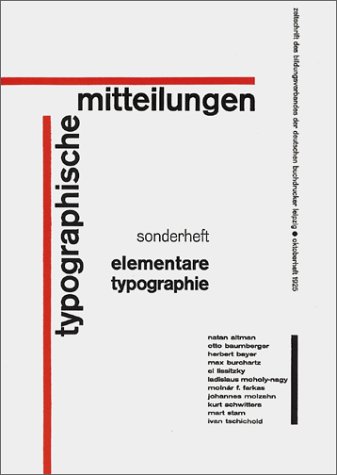
“New Typography uses white space to create visual intervals in an asymmetrical layout. An underlying grid unifies the page. Personal expression is rejected in favor of order and clarity. The predominant graphic design style in the world by the 1970s, the Swiss style is recognizable by its strong reliance on typography, usually sans serif type in flush left alignment.”

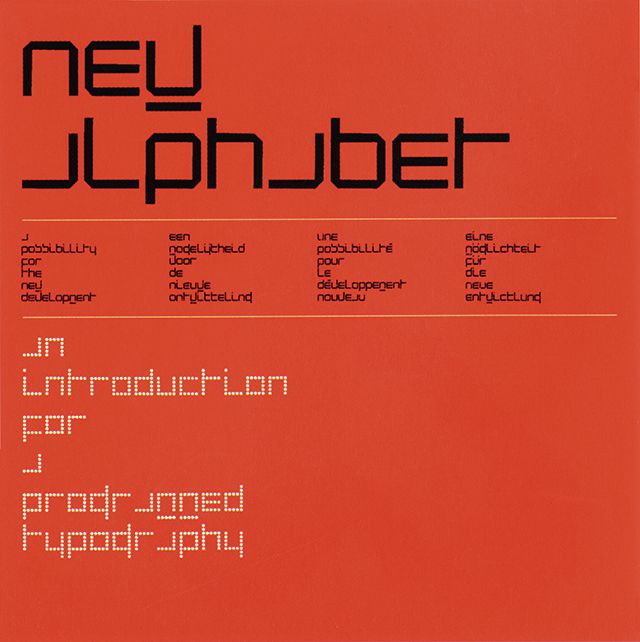
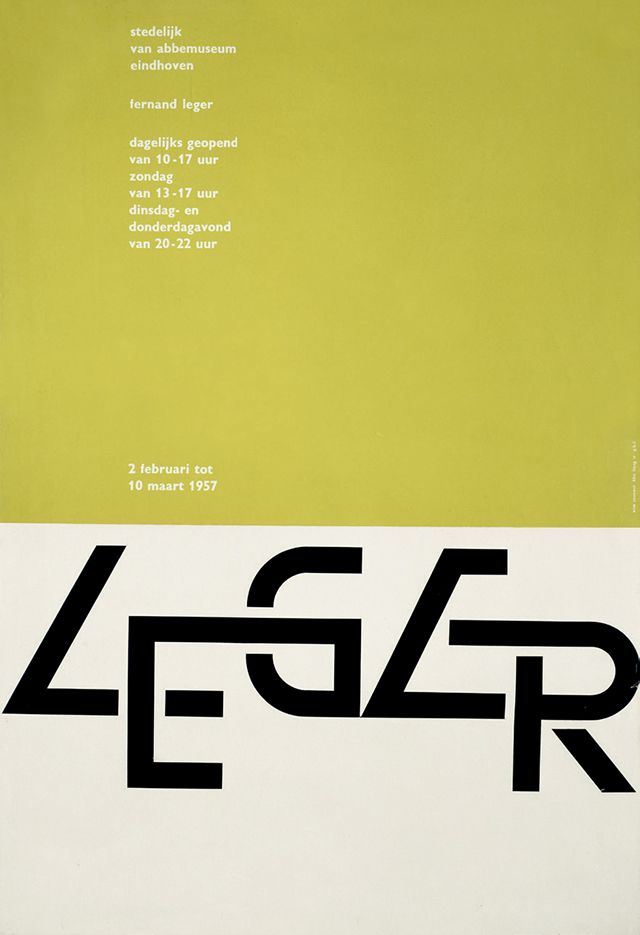
Late Modernism occurred in the economic boom in the 1950’s. Wim Crouwel’s posters from 1960’s-1980’s have a similar appearance to design now:

1967s New Alphabet Typeface. https://speckyboy.com/icons-graphic-design-wim-crouwel/
Wim Crouwel Leger Poster, 1957.

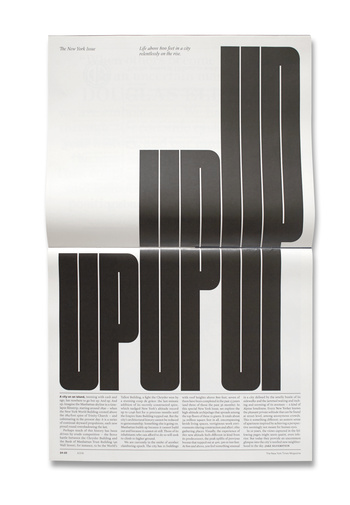
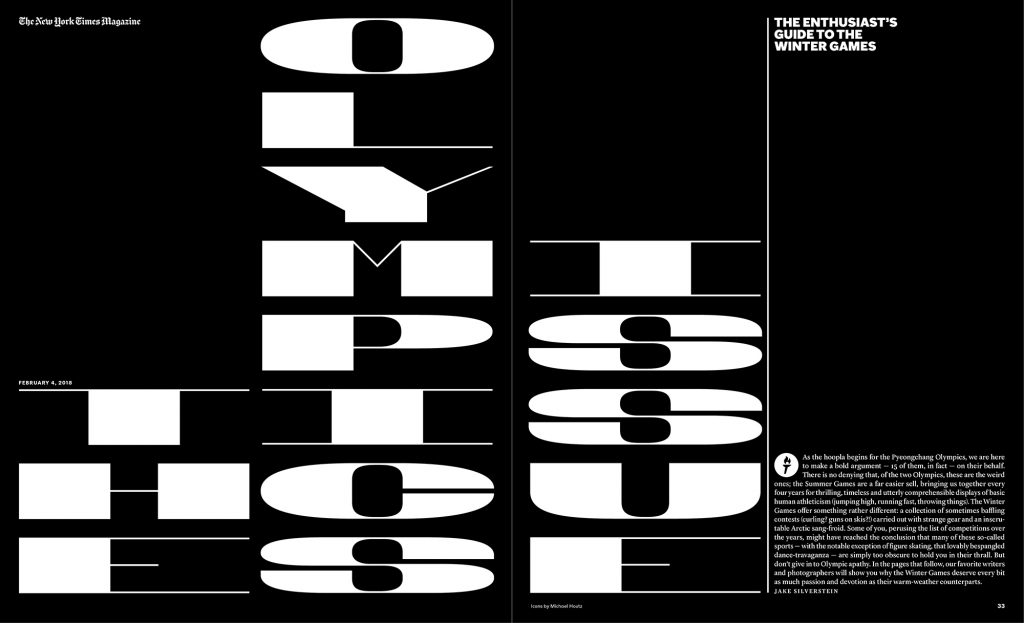
Matt Willey- contemporary designer

The New York Times magazine
NYT Olympics
Post-Modernism

“Post-Modernism developed following the Second World War and questions the very notion that there is a reliable reality through deconstructing authority and the established order of things by engaging the idea of fragmentation, incoherence and the plain ridiculous.

Post-Modernism returned to earlier ideas of adornment and decoration, celebrating expression and personal intuition in favour of formula and structure.”

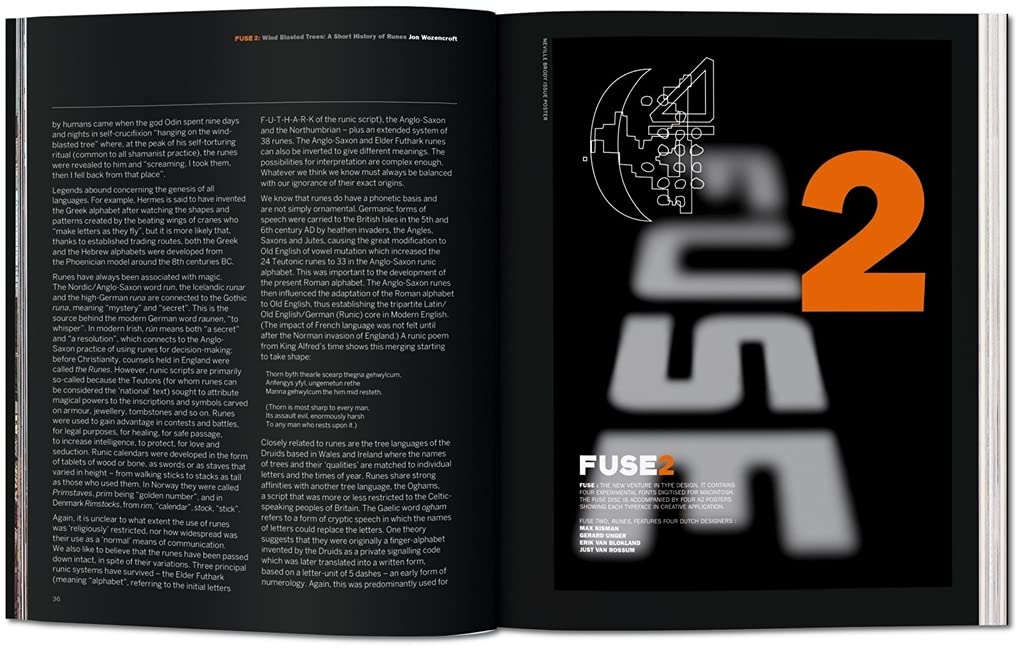
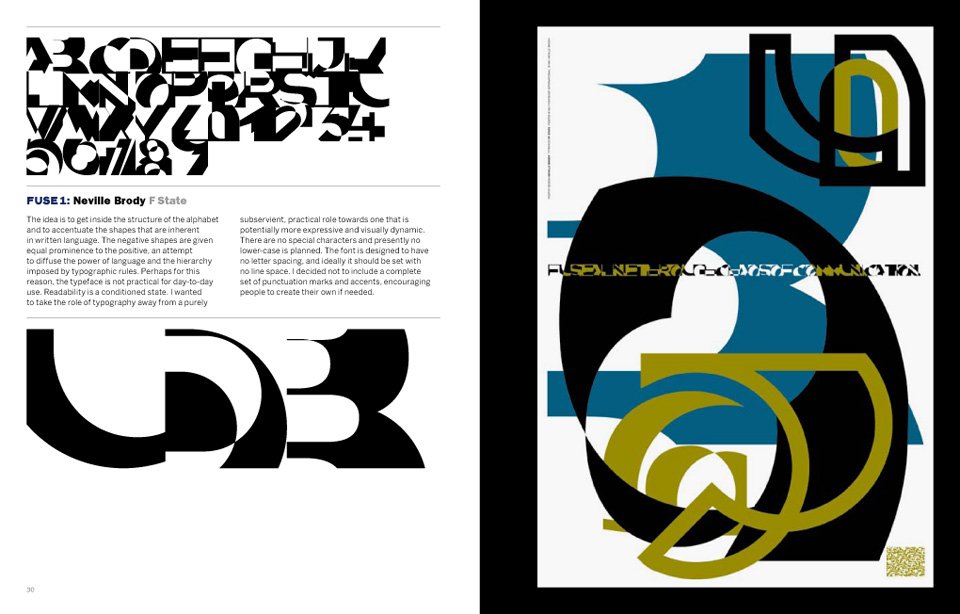
Fuse magazine, founded by Neville Brody and John Wozencroft

An example of Post-Modernism, the designers expressed their imagination across the pages. Sometimes readability was compromised, as form reigned over function. The magazine was produced at the time when computer technology allowed designers to experiment with new tools.

Fuse 2, Runes: Edition Poster design by Neville Brody, 1991 https://www.amazon.co.uk/FUSE-1-20-TASCHEN/dp/3836525011
https://thefontfontyeahs.wordpress.com/2012/09/19/fuse-1-20/

Automation is a phrase that is used to describe the transition from the old skilled job (for example, of typography) to the present digital age where the digital design tools are available to anyone.

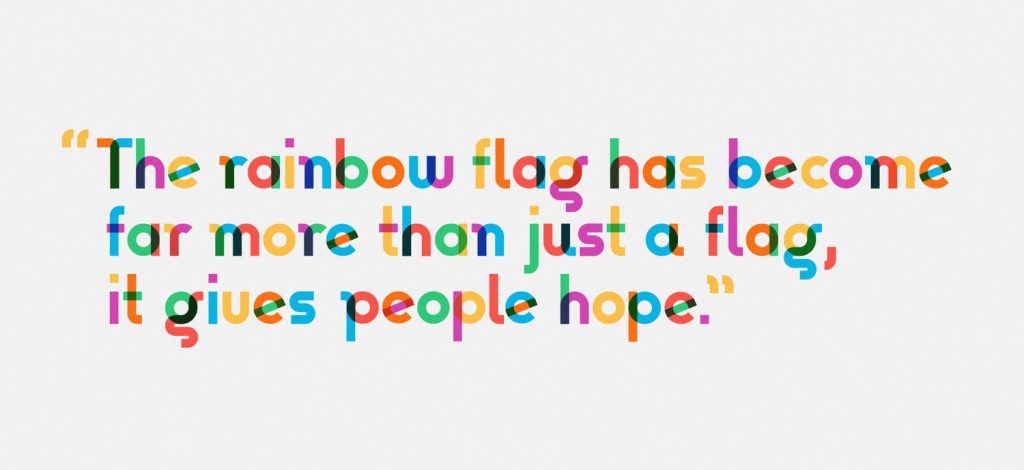
Gilbert, Type with Pride https://www.typewithpride.com/

“On 31 March, 2017, Gilbert Baker the creator of the iconic Rainbow Flag sadly passed away. Mr. Baker was both an LGBTQ activist and artist, and was known for helping friends create banners for protests and marches. To honor the memory of Gilbert Baker, NewFest and NYC Pride partnered with Fontself to create a free font inspired by the design language of the iconic Rainbow Flag, the font was named ‘Gilbert’ after Mr. Baker.” This is one of the world’s first coloured fonts.

“The colour combinations are blended on letters to represent the ‘open and fluid communities’ that make up LGBTQ.” (from The Fundamentals of Typography 3rd edition)

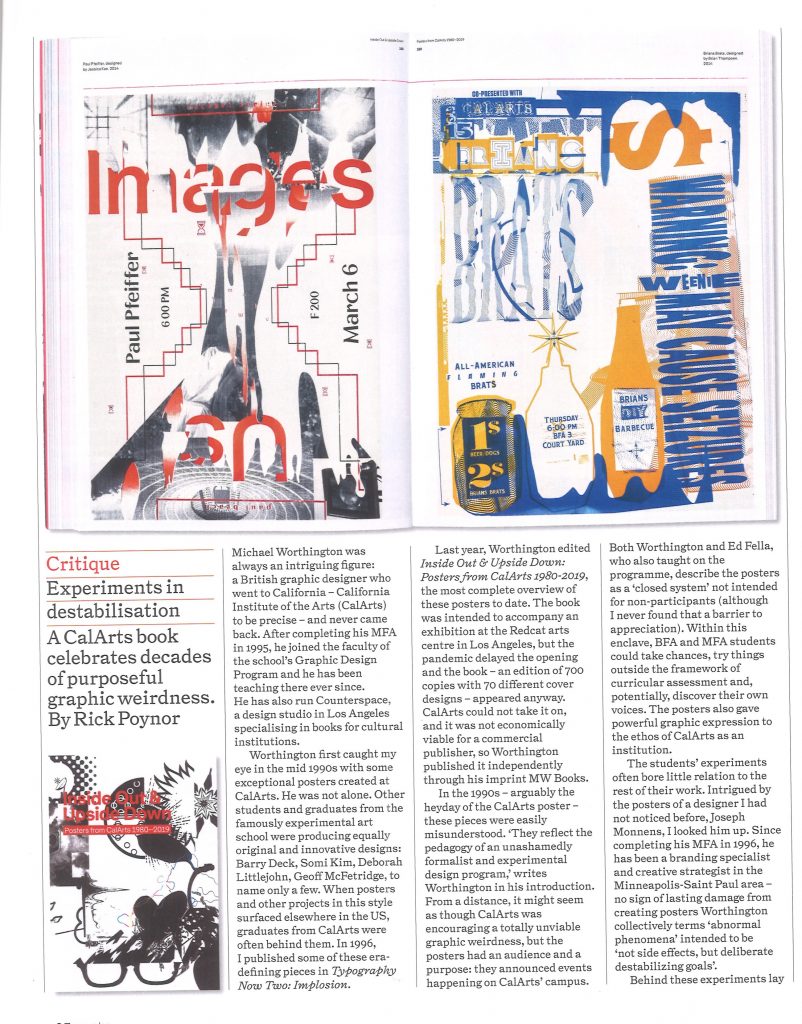
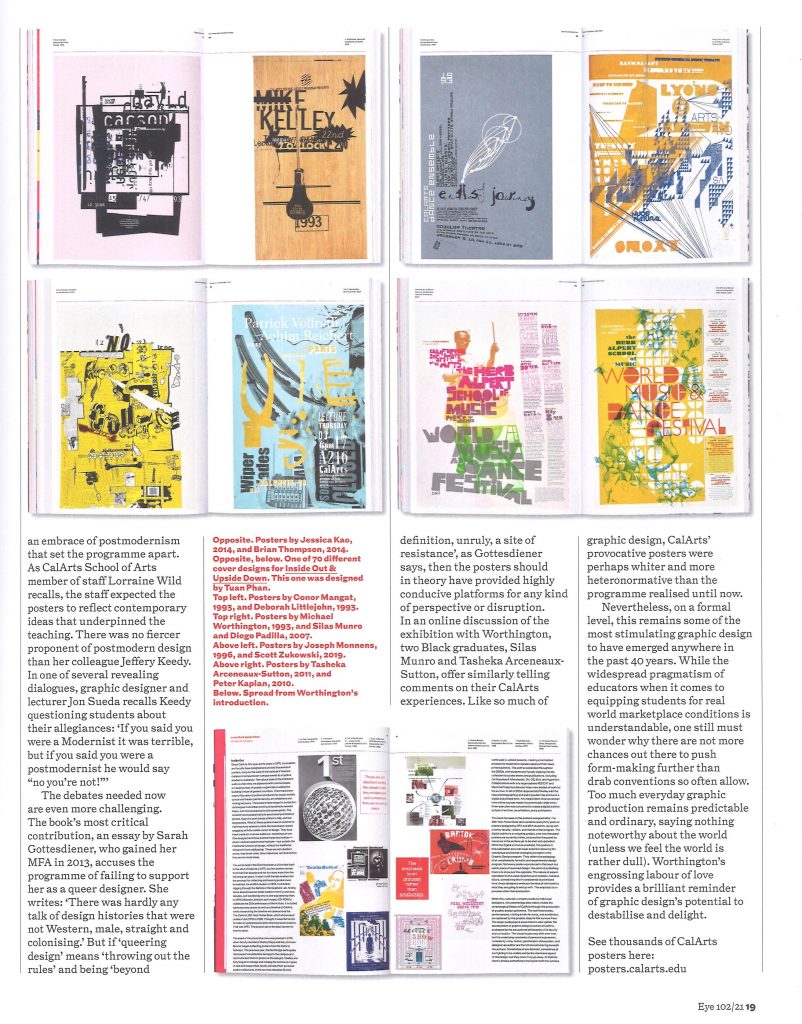
Postmodern design:

Eye Magazine, Issue 102